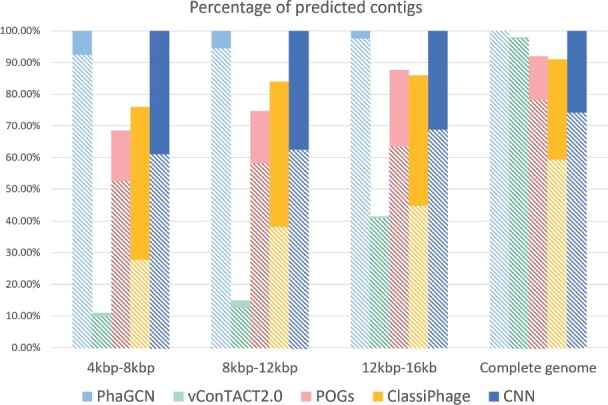
Fig. 5.

The percentage of classified contigs and classification accuracy (Equation 12) of each model on simulated contigs, which are randomly sampled from phage genomes. Each bar shows the percentage of classified contigs. The solid part shows the misclassification rate and the bottom part with patterns represents the macro-accuracy
