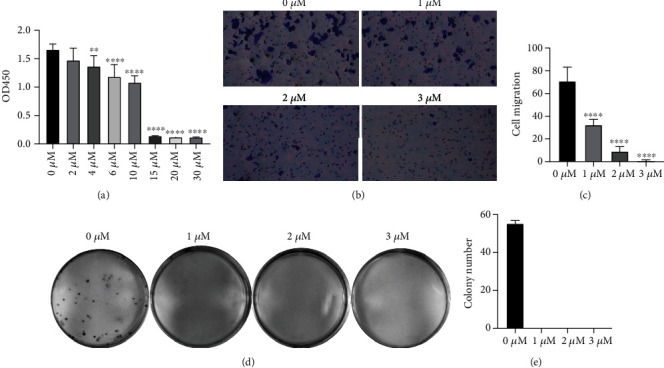
Figure 1.

Oridonin limited T24 cell proliferation, colony formation, and migration. (a) Proliferation of T24 cells treated with oridonin (0, 2, 4, 6, 10, 15, 20, or 30 μM). (b, c) Migratory ability of T24 cells treated with oridonin (0, 1, 2, or 3 μM) and vs. the untreated control (0 μM). Magnification ×200. (d, e) Colony formation capacity of T24 cells treated with oridonin (0, 1, 2, or 3 μM).
