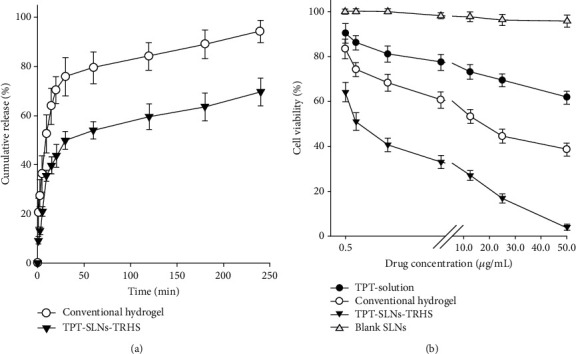
Figure 4.

(a) Dissolution profile of drug from TPT-SLNs-TRHS as compared to conventional hydrogel. Each value represents the mean ± S.D(n = 3). All values in TPT-SLNs-TRHS and conventional hydrogel were meaningfully different at each time. ∗P < 0.05 as compared to conventional hydrogel. (b) In vitro cytotoxicity of blank SLNs, TPT-SLNs-TRHS, TPT solution, and conventional hydrogel after 24 h exposure in SCC-7. Data is expressed as the mean ± S.D (n = 8).
