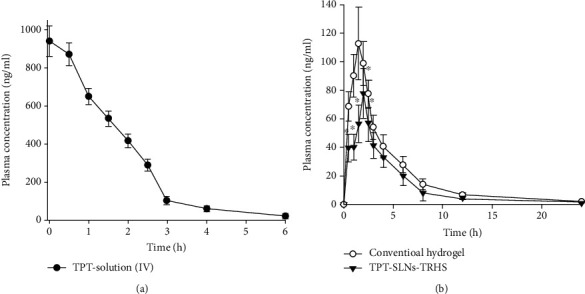
Figure 5.

Plasma concentration vs. time profile after equivalent drug quantity administration of TPT in rats. The TPT solution was IV given whereas TPT-SLNs-TRHS and conventional hydrogel was rectally administered. Each value represents the mean ± S.D(n = 6).∗P was noted significantly different (<0.05) when compared with conventional hydrogel.
