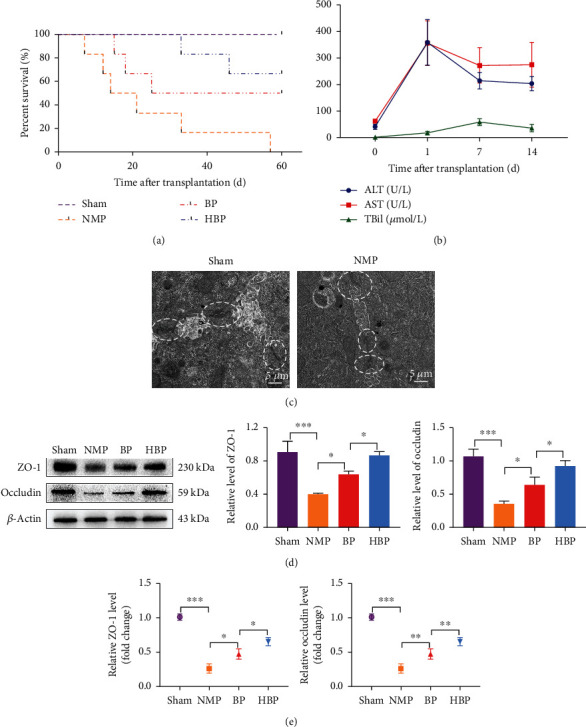
Figure 2.

Survival, liver function, and bile ductule ultrastructure of DCD liver transplantation recipients. (a) Survival curve of DCD liver transplantation recipients (n = 6 per group). HO-1/BMMSCs combined with NMP improved the survival time of the recipients. Median survival time of sham, NMP, BP, and HBP groups was >60 days, 17.5 days, 42.5 days, and >60 days, respectively. (b) Liver functions of the NMP group on the 1st, 7th, and 14th day postoperatively (n = 5). ALT and AST reached their peak values on the postoperative day 1 and TBil on the 7th day. After the 7th postoperative day, all indexes gradually leveled off. (c) On the 7th day postoperatively, transmission electron microscopy (TEM) showed destruction of tight junctions (white ellipses) of bile ductules after liver transplantation compared with the normal liver. Western blotting (d) and PCR (e) showed that expression levels of tight junction proteins (ZO-1 and occludin) in the HBP group were higher than those in the BP and NMP groups (n = 3). ∗P < 0.05, ∗∗P < 0.01, and ∗∗∗P < 0.001. DCD: donors after circulatory death; NMP: normothermic machine perfusion; BMMSCs: bone marrow mesenchymal stem cells; HO-1: heme oxygenase-1; HBP: HO-1/BMMSCs plus NMP; BP: BMMSCs plus NMP; ALT: alanine aminotransferase; AST: aspartate aminotransferase; TBil: total bilirubin.
