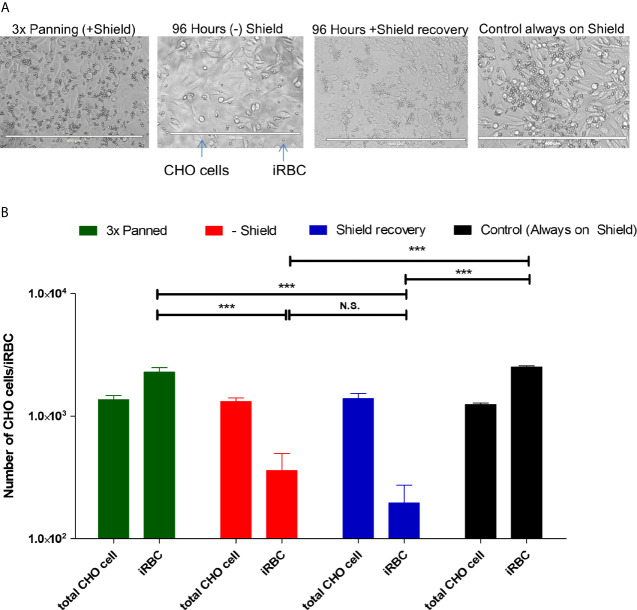
Figure 4.
Adherent phenotype analysis shows decreased cytoadherence of IRBC during and after knockdown. (A) Illustrative recording of each condition. From these pictures, cells and the infected red blood cells were counted. The white bar at the bottom of each picture indicates 400 µm. (B) Graphic representation of three independent experiments. The significance of difference in numbers of adhering iRBC was calculated using Student’s T-Test, and three asterisks indicate p values <0.005. N.S. is not significant. “Controls” are the 3× CHO-CD36 selected cultures that were cultivated with Shield-1 throughout the test and analyzed at the same timepoint as the knocked-down and Shield-1 re-added cultures.

