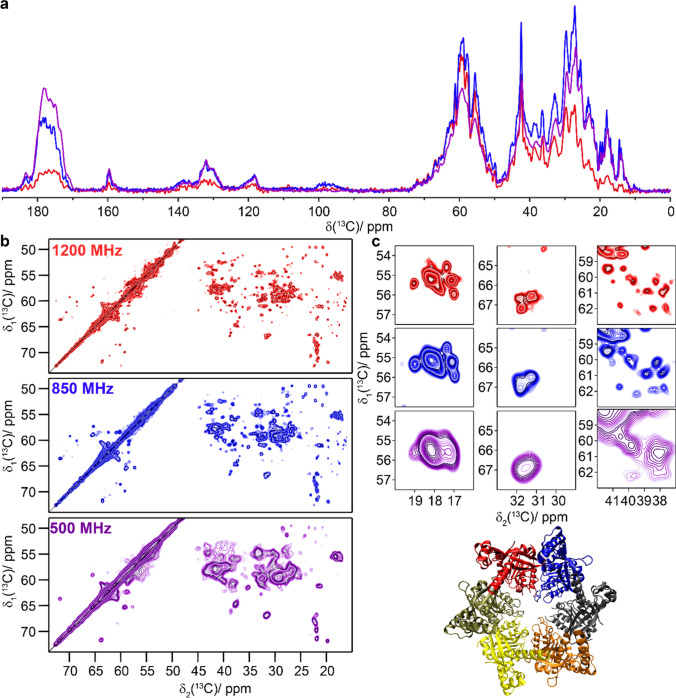
Fig. 3.
The bacterial DnaB helicase. a 1D 13C-detected CP-MAS spectra recorded at 500, 850, and 1200 MHz; b 20 ms DARR spectra recorded at the same magnetic fields as in a. c Expanded regions from the spectra in b. Spectra colored in purple were measured at 500 MHz, spectra in blue were recorded at 850 MHz and spectra in red were measured at 1200 MHz. CP was matched at 55 and 29 kHz for 1H and 13C at 1200 MHz and at 60 and 43 kHz at 500 and 850 MHz. The 1D spectra in a were scaled to a similar noise level. Structural model with each subunit colored differently (PDB ID: 4ZC0) (Bazin et al. 2015)

