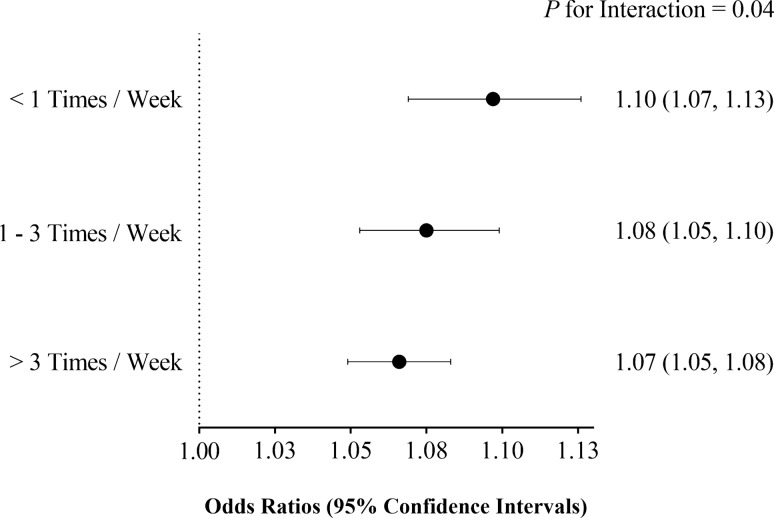
Fig. 1.
Association of T2D-GRS with risk of T2D stratified by different fruit intake levels. The odds ratios [OR, 95% confidence intervals (CI)] under each fruit intake levels were derived from multiple logistic regression models using the T2D-GRS and covariates as independent variables; the P for interaction values were calculated using the T2D-GRS, fruit intake level, T2D-GRS × fruit intake level, and covariates together as independent variables. The shown data were after adjustments for age, gender, BMI, SBP, DBP, Log-TG, TC, LDL-C, HDL-C, smoking, drinking, physical activity and principle components of dietary factors

