Figure 1.

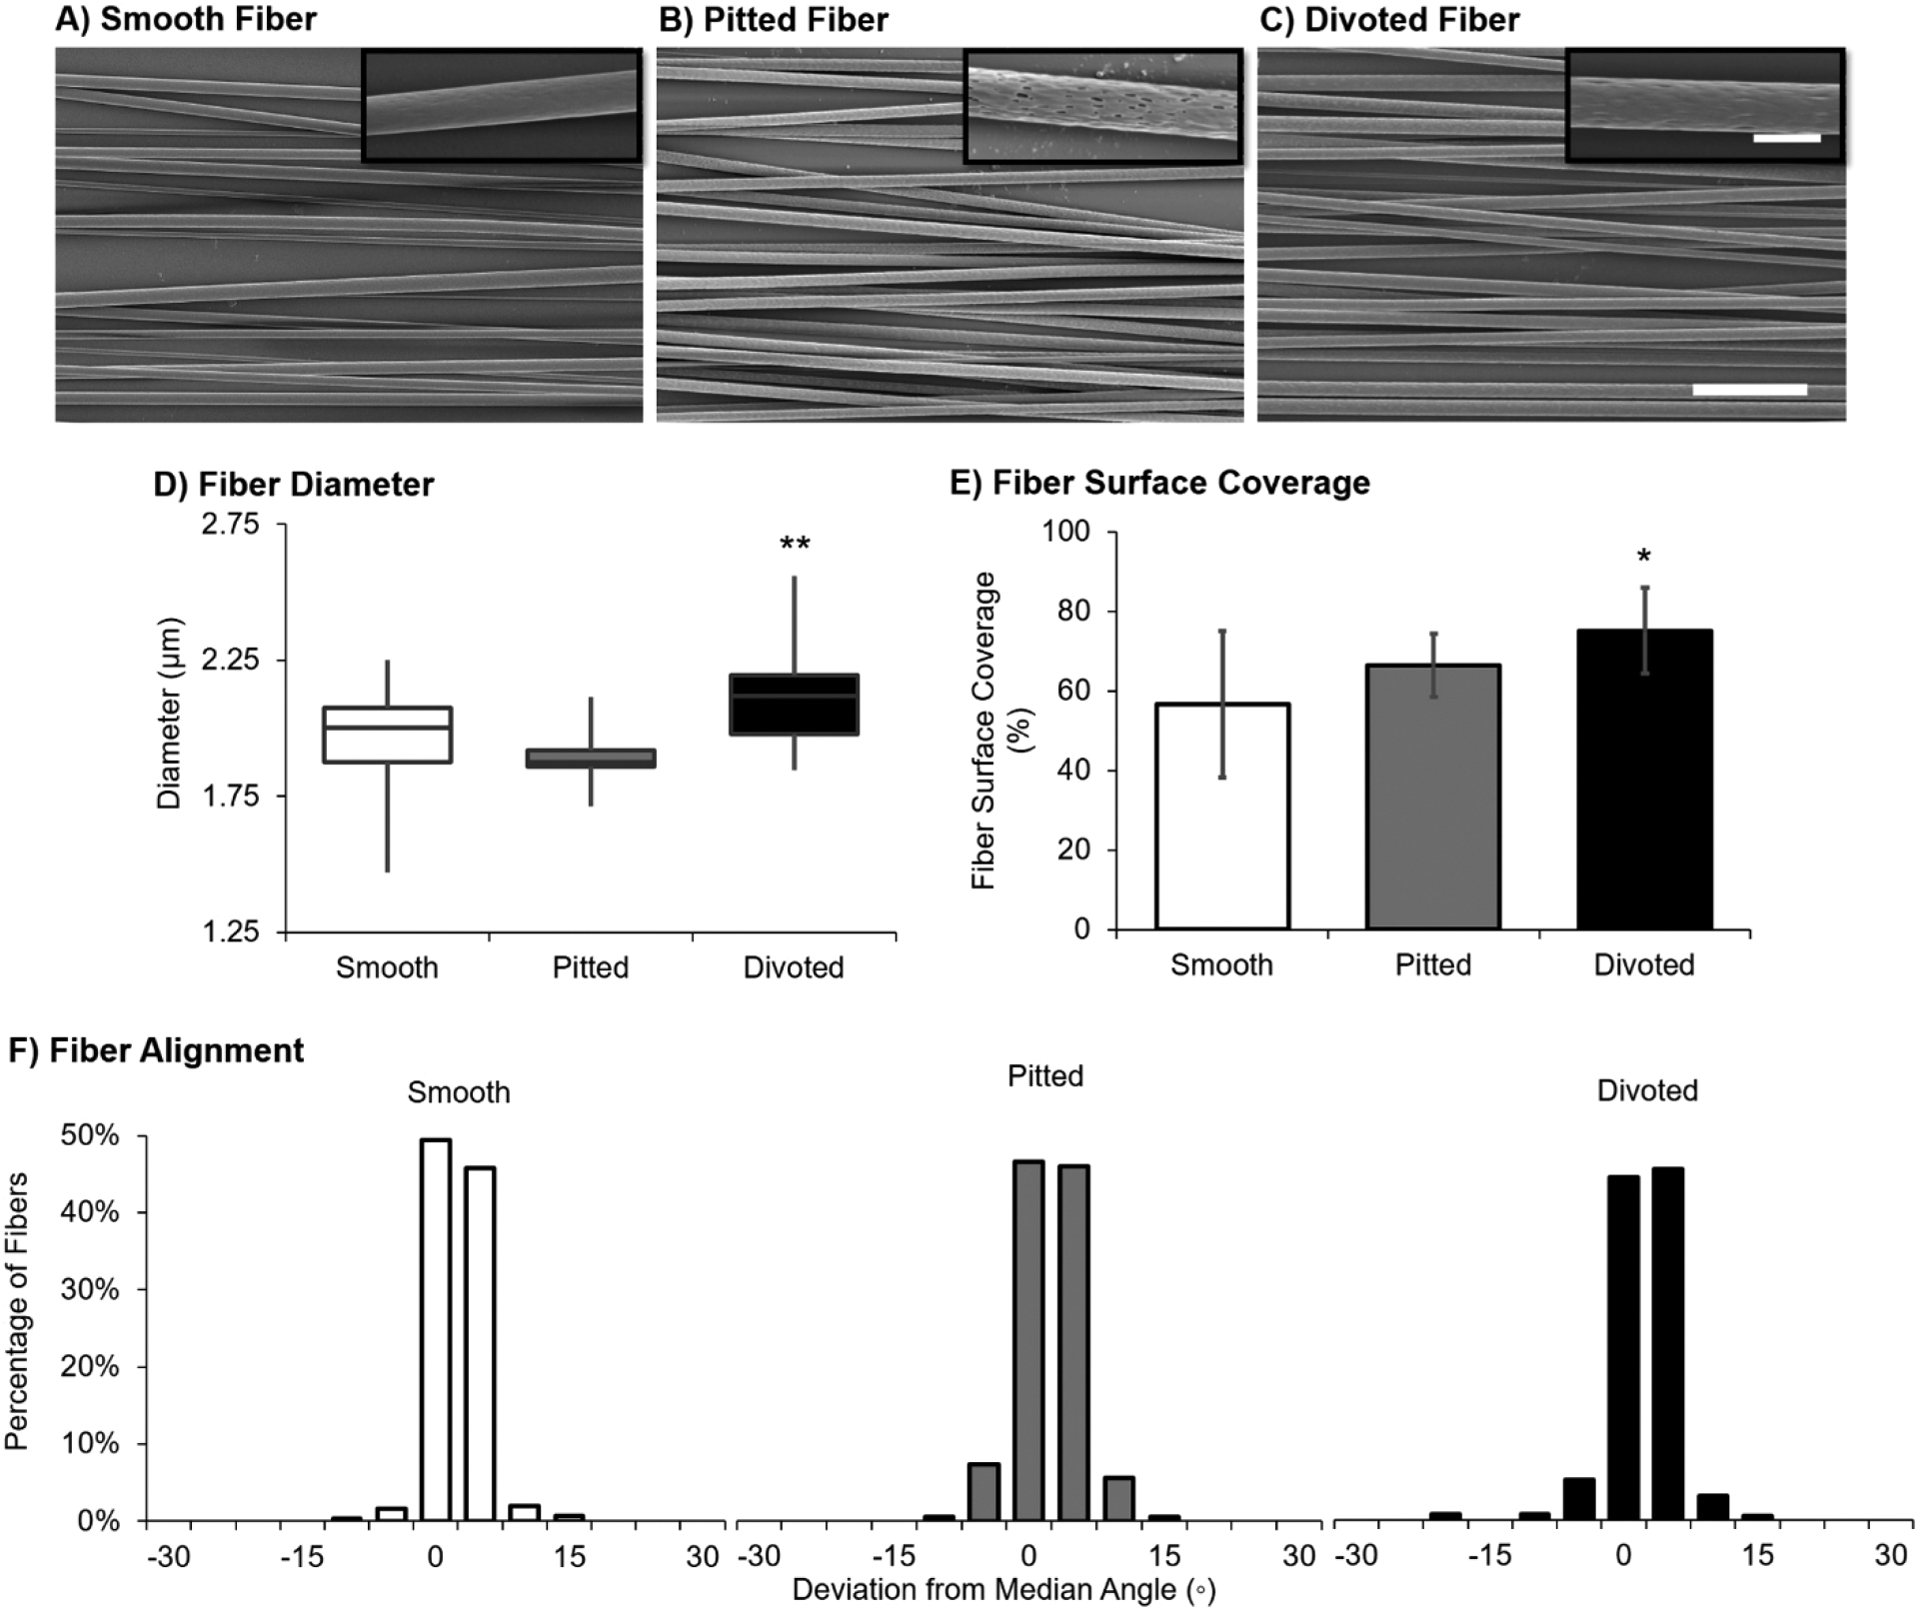
Uncoated fibers with varying surface nanotopographies have similar microscale surface characteristics. SEM image of (A) smooth, (B) pitted, and (C) divoted fibers, scale bar for 2000× magnification images = 20 μm and scale bar for 15000× magnification images = 3 μm. (D) Fiber diameter data (in μm) are represented as a plot of boxplots. (E) Fiber surface coverage is represented as the mean percentage of surface covered by fibers ± standard deviation. (F) Fiber alignment is represented as a set of histograms of the percentage of each type of fibers with a deviation from the median fiber angle in degrees. Statistical differences compared to the smooth fiber control were assessed using Welch’s ANOVA with post hoc Games–Howell test (*p < 0.05; **p < 0.001). For all assessments, a minimum of 15 fields of view from n = 3 independently fabricated batches were characterized.
