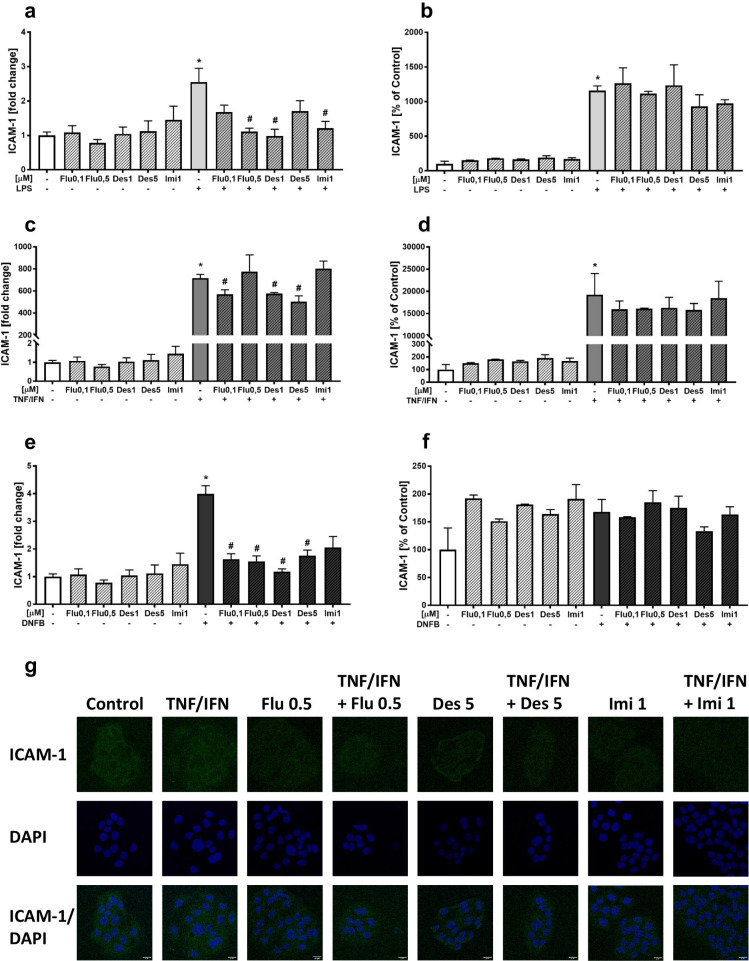
Fig. 2.
The effect of antidepressants on the gene expression of ICAM-1 (left panel; a, c, e) and the protein level of ICAM-1 (right panel; b, d, f) in HaCaT cells after stimulation with LPS, TNF-α/IFN-γ, and DNFB. The expression of ICAM-1 in cell lysates was determined after 4 h of incubation, and the results are presented as the mean fold change (± SEM) relative to the reference gene (GAPDH). ICAM-1 protein level was assessed by ELISA after 24 h incubation; in cell culture lysates, the measurement was done in pg/mg protein, the averaged results are presented as % control (± SEM). The presented data come from three different experiments (for individual types of assays), where for each group, there were 3 wells of cell culture. *p < 0.05 vs. control, #p < 0.05 vs. appropriate stimulated group. Representative fluorescence photomicrographs g showing the effect of TNF-α/IFN-γ and antidepressants: fluoxetine (Flu, 0.5 µM), desipramine (Des, 5 µM), or imipramine (Imi, 1 µM) on ICAM-1 expression in HaCaT cells, incubated for 1 h. The ICAM-1 signal was immunodetected using anti-human, staining with anti-CD54 PE (ICAM-1) antibody, and nuclei were stained using DAPI labeling. Scale bar (20 μm) is located in the bottom right corner of each image. Flu, fluoxetine; Des, desipramine; Imi, imipramine; LPS, lipopolysaccharide; TNF/IFN, tumor necrosis factor (TNF)-α/interferon (IFN)-γ; DNFB, 2,4-dinitrofluorobenzene

