Figure 6.
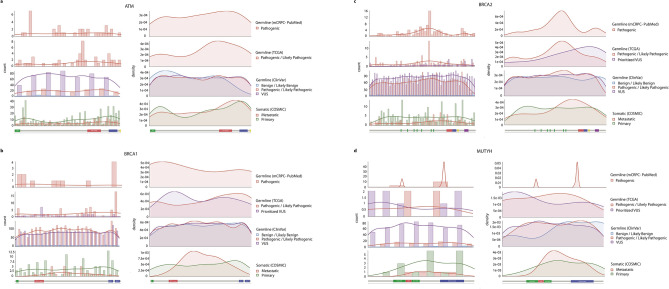
Co-localization of germline and somatic variants in ATM, BRCA1, BRCA2 and MUTYH. Panel (a): Histograms and density distributions for different types of variants in ATM. The histograms in the left-hand column show the counts of each variant type in bins of 75 residues along the sequence. They show: germline variants identified in different cohorts of mCRPC collected from the literature (PubMed), germline variants from TCGA, germline variants from ClinVar, and somatic variants from COSMIC. Where more than one type of variant is plotted the widths of the bars in each bin are reduced accordingly. To the right of each histogram are the equivalent density distributions, as computed by smoothing the histogram bars. A small version of the Pfam domain layout is also shown beneath the histograms and density distributions. Panels (b–d) show the data for BRCA1, BRCA2, and MUTYH, respectively.

