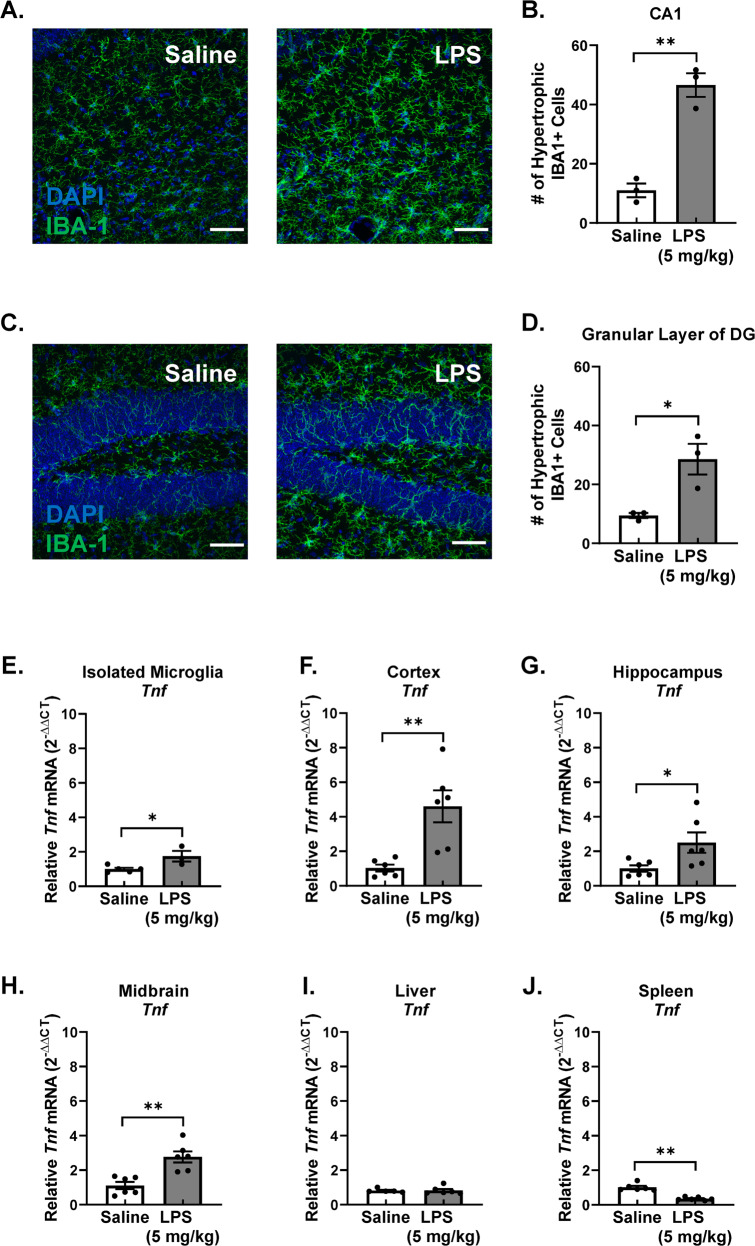
Fig. 1. The persistent pro-inflammatory microglia response 7 days after LPS administration in a Murine GWI-like model.
Male C57BL/6 mice received a single IP injection of LPS or saline. Microglia morphology and neuroinflammation were assessed 7 days later in this model of Gulf War Illness—like neuroimmune responses that persist long after the instigating stimulus. Immunofluorescent assessment of microglia morphology changes in the (A) CA1 region and (C) the granular layer of the DG was performed, where representative maximum intensity projection images taken at ×40 are shown, the scale bar depicts 50 μm, and IBA1 (green) and DAPI (blue) are stained. The number of hypertrophic IBA1 + microglia cells were counted in the (B) CA1, and (D) granular layer of the DG. Hypertrophic cell = volume > 500 μm3. Data are reported as the mean ± SEM. *p < 0.05 and **p < 0.01 when compared to control (n = 3). To determine the source of the pro-inflammatory response, Tnf (TNFα) mRNA levels were measured in the (E) isolated microglia, (F) cortex (G) hippocampus, (H) midbrain, (I) liver, and (J) spleen by qRT-PCR and normalized to Gapdh using the 2-ΔΔCT method. Data are reported as the mean ± SEM. *p < 0.05 and **p < 0.01 when compared to control (n = 3–6).

