
Fig. 3. The persistent pro-inflammatory microglia (PPM) transcriptome.
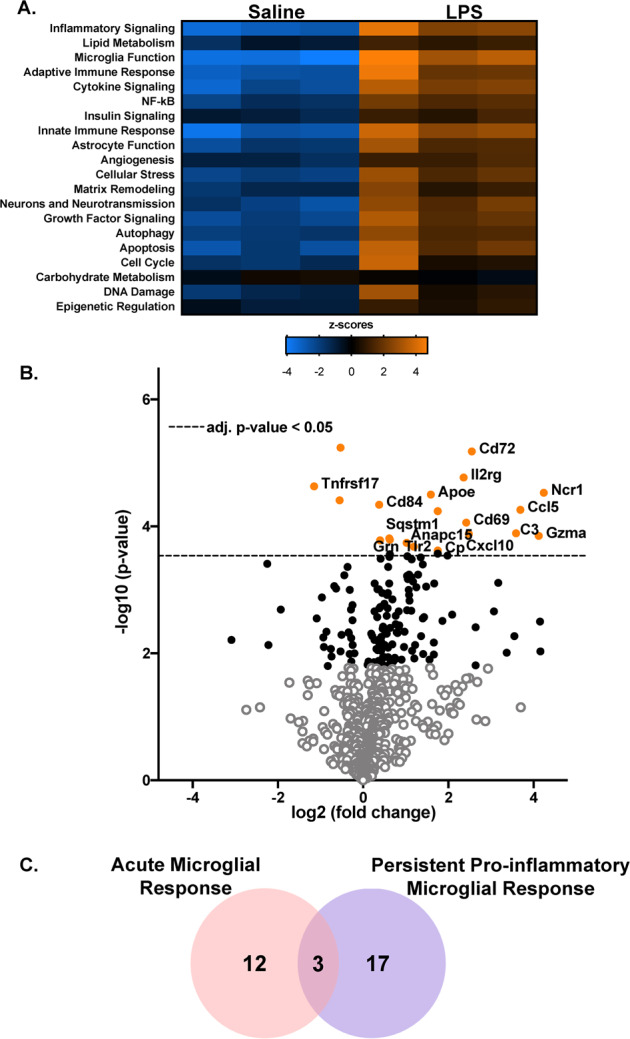
Male C57BL/6 mice received a single IP injection of LPS or saline and microglia were isolated from whole brains at 7 days later. The nanoString Mouse Neuroinflammation Panel was used to determine differential mRNA expression. (A) Hierarchical clustering of the differentially expressed genes was assessed and significantly enriched biological pathways were identified by Ncounter system. A heatmap depicting the gene expression by category is depicted for the saline and LPS treatment at 7 days after administration. Orange indicates high expression; blue indicates low expression. (B) A volcano plots depicting the differential mRNA expression in 7 days LPS vs Saline. Values shown are the log2 (fold change) ratios of LPS treatment with respect to the saline group plotted against the −log10 (p-value). The black dots denote the analyzed genes with p-value below the given False Discovery Rate (FDR) or p-value threshold. The horizontal line indicates the False Discovery Rate (FDR) threshold or adjusted p-value <0.05 determined by the Benjamini–Yekutieli and the orange dots indicate the most statistically significant genes (p < 0.05). (C) The Venn diagram illustrates the overlap of significantly modified genes by treatment (n = 3).