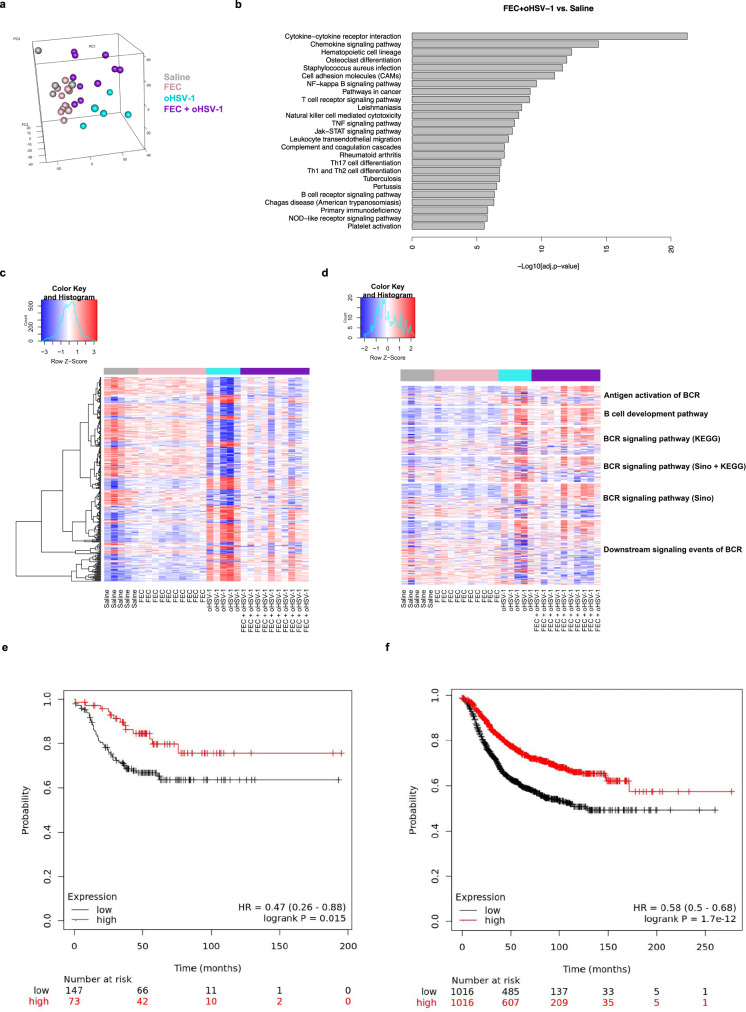
Fig. 5. FEC + oHSV-1 induces significant upregulation in RNA transcriptomes associated with immune processes and pathways and more specifically, B-cell receptor signaling pathways.
a 3-D cluster plot showing the RNA expression correlations between mice treated with saline (gray; n = 5), FEC (pink; n = 10), oHSV-1 (teal; n = 5) and FEC + oHSV-1 (purple; n = 10). b Bar plot illustrating the results of pathway enrichment analysis performed on samples from mice treated with FEC + oHSV-1, compared to those treated with saline alone. c Heat map showing the normalized expression values of genes across all samples. d Heat map showing the normalized expression values of genes associated with B-cell receptor pathways. e Kaplan–Meier survival plot for TNBC patient RFS (n = 220) microarray data based on mean mRNA expression level of the top 29 available genes in Table S1. f Kaplan–Meier survival plot for all breast cancer patients RFS (n = 2032) based on mean mRNA expression levels of the top 29 available genes in Table S1. *BCR B-Cell Receptor.

