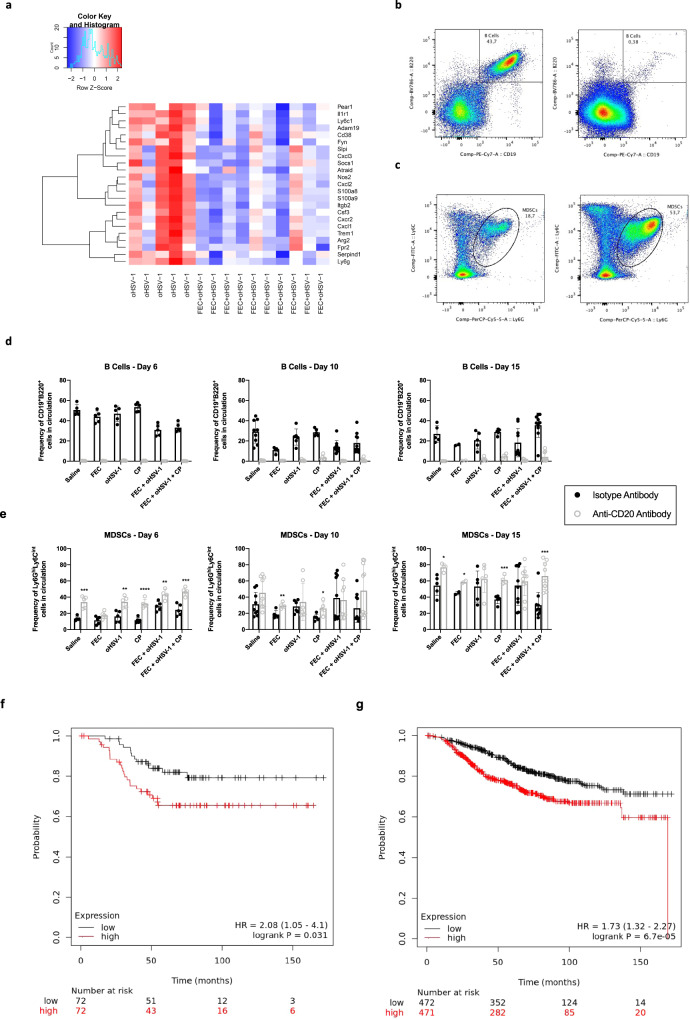
Fig. 7. Absence of circulating B cells results in rapid expansion of granulocytic MDSCs.
C57/Bl6 mice bearing E0771 tumors were treated with either an anti-CD20 mAB or isotype mAB, followed by treatment with saline, FEC, oHSV-1, CP, FEC + oHSV-1, or FEC + oHSV-1 + CP. Blood was drawn on days 6, 10, and 15 and analyzed via flow cytometry. a Heat map showing selected MDSC-related genes and their expression across all oHSV-1 and FEC + oHSV-1 samples, as determined by whole tumor RNA sequencing analysis. b Representative flow plot showing the gating strategy for B cells (CD19+B220+ cells) in mice treated with the isotype mAB (left) and an anti-CD20 mAB (right). c Representative flow plot showing the gating strategy for MDSCs (Ly6GhiLy6Cint cells) in mice treated with the isotype mAB (left) and the anti-CD20 mAB (right). d Bar plots showing the frequency of B cells in circulation across all timepoints. e Bar plots showing the frequency of MDSCs in circulation across all timepoints. f Kaplan–Meier survival plot for TNBC patients OS (n = 144) based on mean expression levels of a signature comprised of all available genes from Table 1. High versus low expression defined as above or below median expression. Logrank p value and hazard ratio (95% confidence interval) are displayed. g Kaplan–Meier survival plot for breast cancer patients OS (n = 943) based on mean expression levels of a signature comprised of all available genes from Table 1. High versus low expression defined as above or below median expression. Logrank p value and hazard ratio (95% confidence interval) are displayed. *Two-tailed unpaired t test was used for statistical analyses. Error bars are representative of standard deviation.

