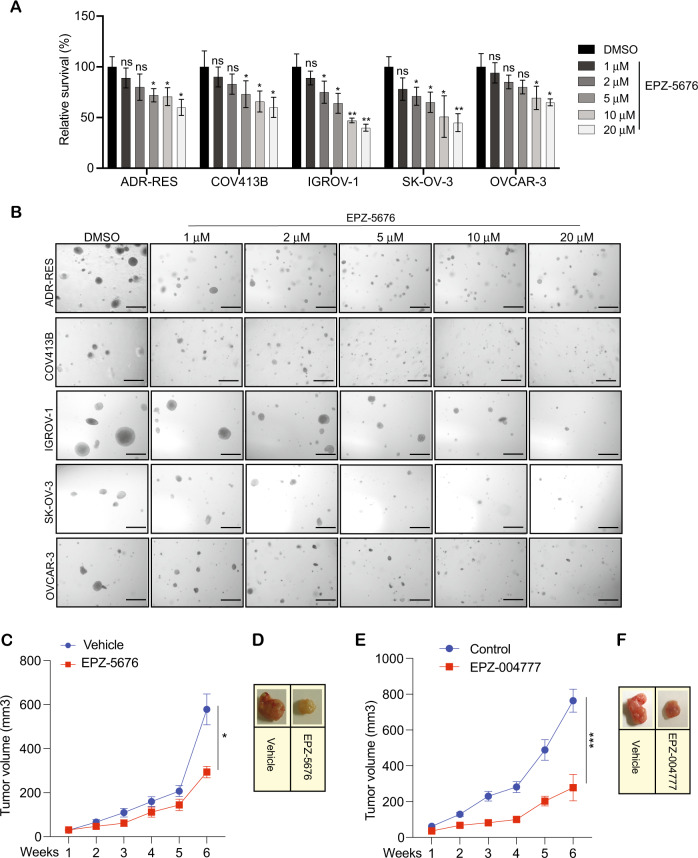
Fig. 3. Pharmacological inhibition of DOT1L inhibits the growth of ovarian cancer cells.
A The indicated ovarian cancer cell lines were treated with the different concentrations of DOT1L inhibitor EPZ-5676 for 3 days and analyzed for cell survival in MTT assays. Relative cell survival is plotted with respect to control treated cells. B The indicated ovarian cancer cell lines were treated with various concentrations of EPZ-5676 and analyzed for the ability to grow in an anchorage-independent manner in soft agar assays. Representative images of soft agar assays are shown. Scale bar, 500 μm. C, D IGROV-1 cells were injected subcutaneously into the flanks of NSG mice (n = 7). The mice were treated with EPZ-5676 (50 mg/kg) intraperitoneally every day and analyzed for tumor growth. Tumor sizes were measured each week and the average tumor volume is plotted (C). Representative images of the tumors from the mice after 6 weeks of EPZ-5676 treatment are shown (D). E, F IGROV-1 cells were injected subcutaneously into the flanks of NSG mice (n = 5). The mice were treated with EPZ004777 (50 mg/kg) intraperitoneally every day and analyzed for tumor growth. Tumor sizes were measured each week and the average tumor volume is plotted (E). Representative images of the tumors from the mice after 6 weeks of EPZ004777 treatment are shown (F). Data were shown as the mean ± SEM, *p < 0.05, **p < 0.01, ***p < 0.001, ns not significant, calculated using the Student’s t-test.

