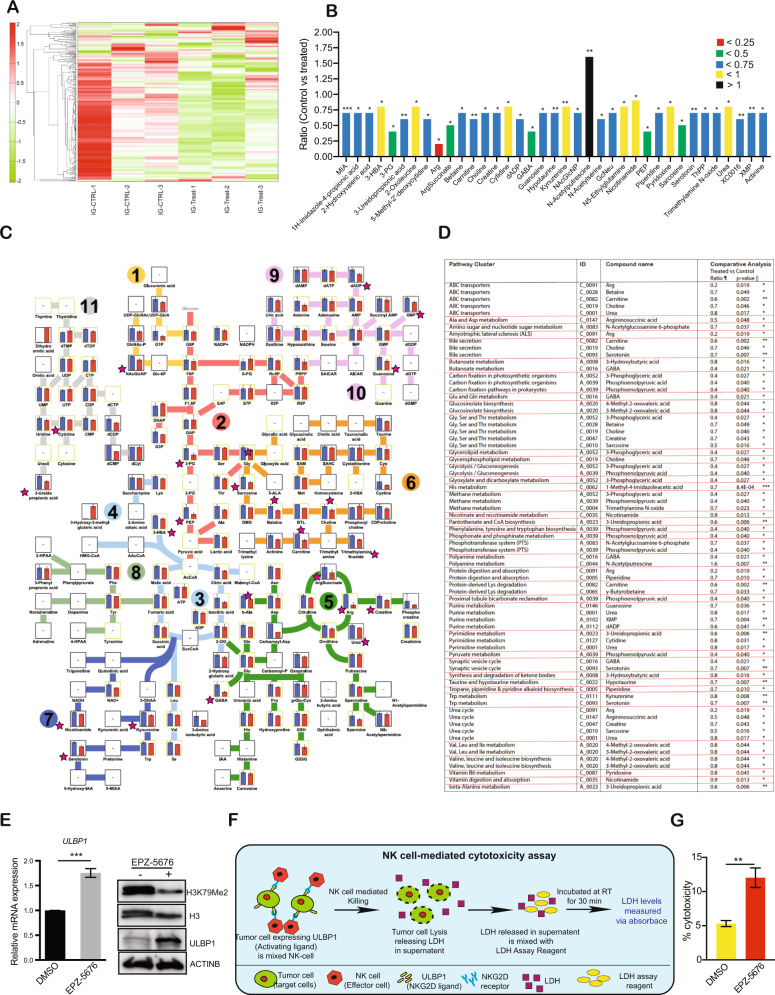
Fig. 6. Pharmacological inhibition of DOT1L inhibits ovarian cancer growth in vivo.
A Heatmaps show the overall metabolite alterations in IGROV-1 cells treated with 10 μM EPZ-5676 for 48 h in comparison with control cells. B Expression level of metabolite that were significantly altered in IGROV-1 cells treated with 10 μM EPZ-5676 for 48 h relative to that in control cells. C Diagram showing the metabolic pathways that were measured in global large-scale metabolomics analysis along with the significantly altered metabolites, which are indicated with a pink star. D Metabolic pathways that were associated with significantly altered metabolites in IGROV-1 cells treated with 10 μM EPZ-5676 for 48 h. E ULBP1 mRNA and protein expression in IGROV-1 cells treated with 10 μM EPZ-5676 for 48 h compared with that in control cells. F Schematics of NK cell-mediated cytotoxic assay. G Bar diagram showing the percentage of NK cell cytotoxicity in IGROV-1 cells treated with 10 μM EPZ-5676 for 48 h compared with the cytotoxicity in control treated cells. Data were shown as the mean ± SEM, *p < 0.05, **p < 0.01, ***p < 0.001, ns not significant, calculated using the Student’s t-test.

