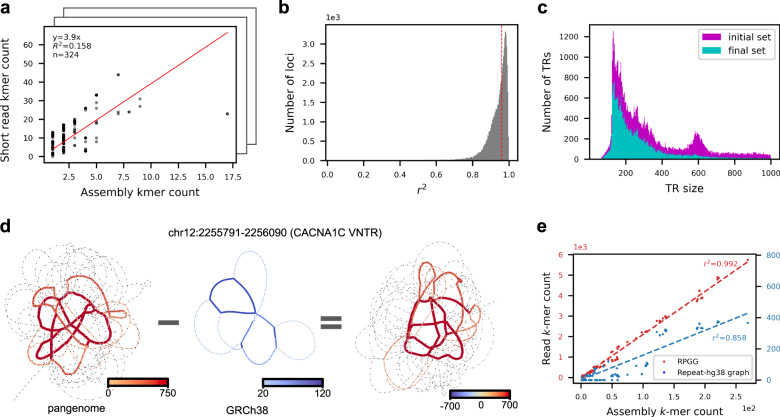
Fig. 2. Mapping short reads to repeat-pangenome graphs.
a An example of evaluating the alignment quality of a locus mapped by SRS reads. The alignment quality is measured by the r2 of a linear fit between the k-mer counts from the ground truth assemblies and from the mapped reads (Methods). b Distribution of the alignment quality scores of 73,582 loci. Loci with alignment quality less than 0.96 when averaged across samples are removed from downstream analysis (Methods). c Distribution of VNTR lengths in GRCh38 removed or retained for downstream analysis. d, e Comparing the read mapping results of the CACNA1C VNTR using RPGG or repeat-GRCh38. d The k-mer counts in each graph and the differences are visualized with edge width and color saturation. To visualize paths with less mapped reads, k-mer counts are clipped at 750 (left), 120 (middle), and 700 (right), respectively, with the maximal k-mer count of each graph being 5744, 375, and 5378, respectively. e The k-mer counts from the ground truth assemblies are regressed against the counts from reads mapped to the RPGG (red) and repeat-GRCh38 (blue), respectively. Source data are provided as a Source Data file.

