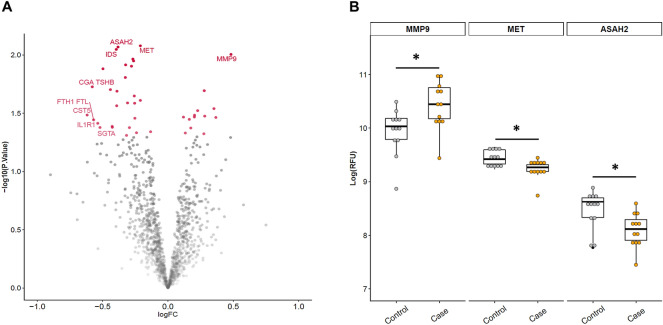
Figure 2.
Discovery phase results. (A) Volcano plot of the discovery study. The y-axis represents − log10 p-value, and the x-axis represents the log2 fold change. Values greater or less than 0 indicate upregulated and downregulated genes, respectively. Color and opacity indicate whether features had a significant nominal p-value (red and opaque) or not significant (grey and transparent). Labeled features are those with a nominal p-value < 0.05 and |logFC|> 0.5 or p-value < 0.01. (B) Boxplots of RFU levels of the three selected protein candidates replicated from the discovery study (n = 24). The y-axis represents log(RFU) and the x-axis represents the group (controls, grey; cases, orange). *: P-value < 0.01. ASAH2, neutral ceramidase; MET, hepatocyte growth factor receptor; MMP9, matrix metalloproteinase-9; RFU, relative fluorescence units.

