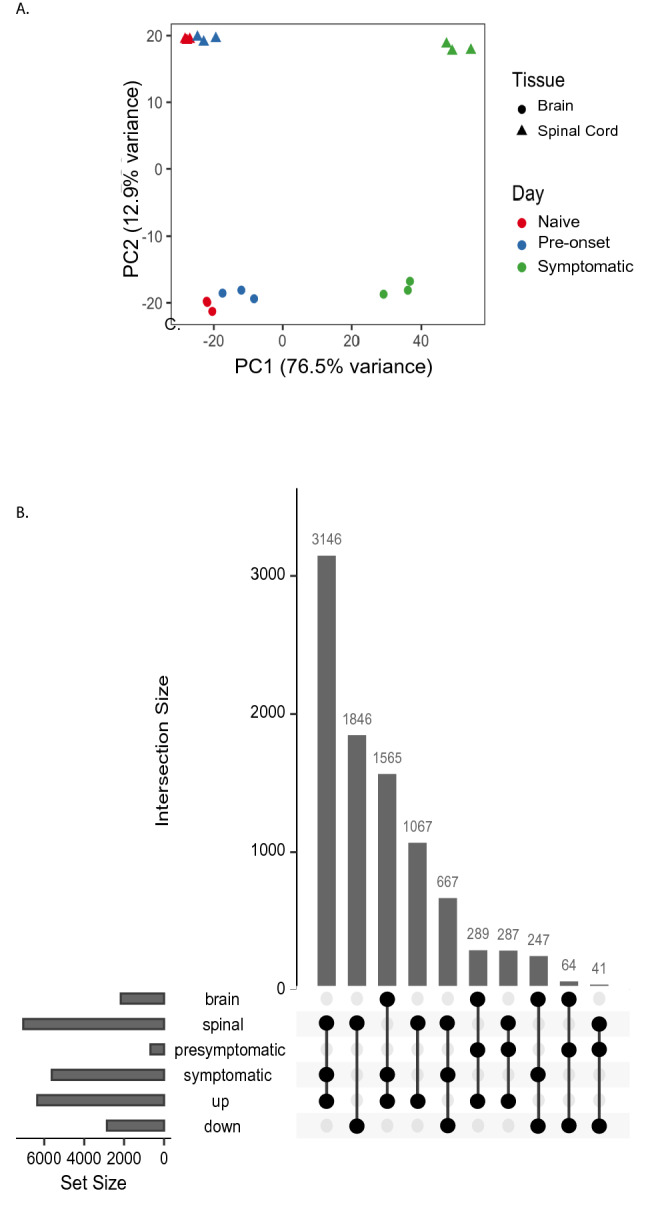
Figure 2.

The RNA transcriptome in heterogeneous between the brain and the spinal cord in different disease states. (A) Principal component analysis of RNA-seq expression profiles for microglia in the brain and the spinal cord and different disease stages. Separation was observed in the brain and the spinal at different disease stages. The variance in X-axis (PC1) is 76.5% and on Y axis (PC2) is 12.9%. (B) UpSeTR diagram showing the number of differentially expressed genes due to each combination of experimental factors using brain in naïve condition as baseline. Three animals per group were used in these experiments71.
