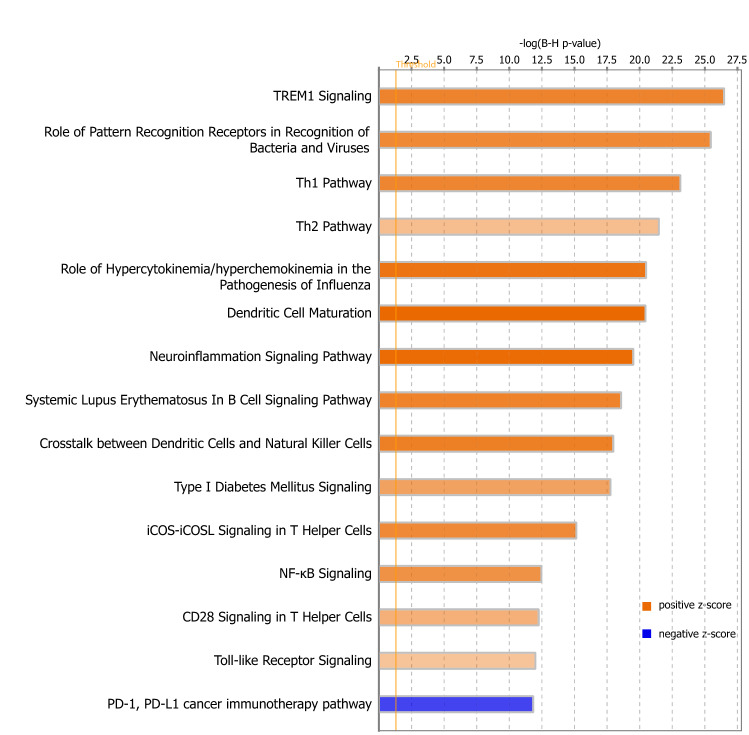
Figure 4.
Changes in symptomatic stage of the disease. Canonical Pathways from IPA. Bars correspond to the top 16 Canonical Pathways that surpassed the Ingenuity statistical threshold using the Benjamini–Hochberg multiple testing correction of Fisher’s Exact Test in both brain and spinal cord of symptomatic animals. The graph was generated through the use of IPA (QIAGEN Inc., https://www.qiagenbioinformatics.com/products/ingenuity-pathway-analysis).

