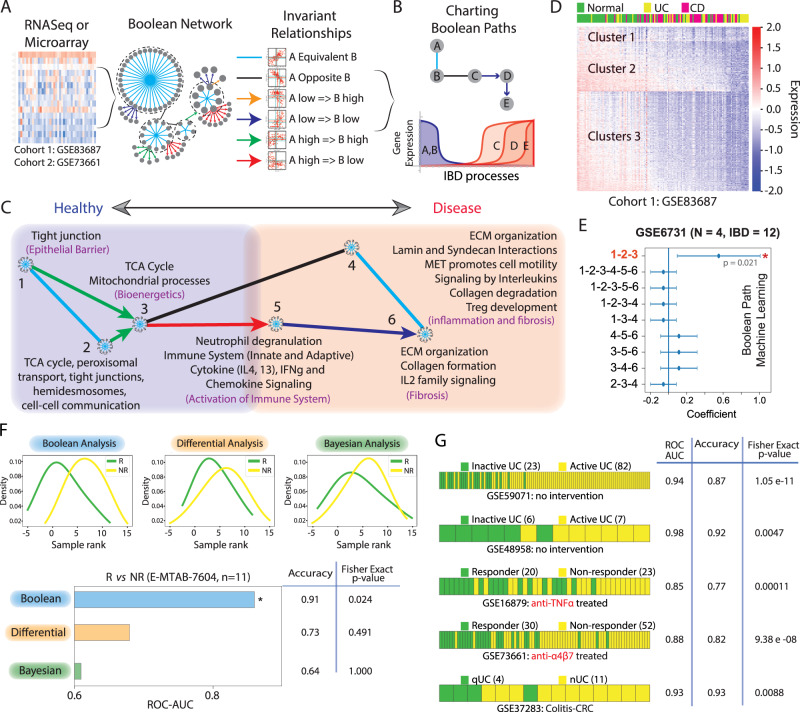
Fig. 2. Generation and validation of Boolean Network map of IBD.
A We applied Boolean Network Explorer (BoNE; see also Supplementary Fig. S1) to analyze two IBD datasets: GSE83687 and GSE7366117,35. The Boolean network (middle) contains the six possible Boolean relationships (right) in the form of a directed graph with genes having similar expression profiles organized into clusters and relationships between gene clusters represented as color-coded edges. B Schematic illustrating how Boolean cluster relationships are used to chart disease paths (Top); and individual gene expression changes along a boolean path, illustrating gene expression dynamics within the normal to IBD continuum (bottom). C Reactome pathway analysis of each cluster along the top continuum paths was performed to identify the signaling pathways and cellular processes that are enriched during IBD progression. [Supplementary Data 2 lists the genes and pathways associated with each gene cluster]. D Heatmap of the expression profile of genes in GSE83687 using Boolean clusters (C#1-2-3) superimposed on sample type (top bar) demonstrates the accuracy of Boolean analysis in sample segregation into normal and IBD. E Selection of Boolean path using machine learning. Linear regression on Test dataset 3 (GSE6731) was used to select the best path that can separate normal and IBD samples. Coefficient of each path score (at the center) with 95% confidence intervals (as error bars) and the p values were illustrated in the bar plot. The p value for each term tests the null hypothesis that the coefficient is equal to zero (no effect). See also Supplementary Fig. S2 for the performance of the selected Boolean path, Clusters #1-2-3, on numerous independent test and validation cohorts. F Direct comparison of Boolean, Differential and Bayesian analysis in predicting responders (R) and non-responders (NR) to anti-TNFα treatment in E-MTAB-7604 (n = 11) dataset. G Prediction of active vs. inactive UC (GSE59071, GSE48958), responder vs. non-responder to treatment with anti-TNFα (GSE16879) and anti-α4β7 (GSE73661) mAbs, quiescent UC without or with remote neoplasia (GSE37283, N = 20) by using Boolean analysis. Fisher exact test (two-sided) is performed on a 2 × 2 contingency table based on the prediction. Source data are provided as a Source Data file.

