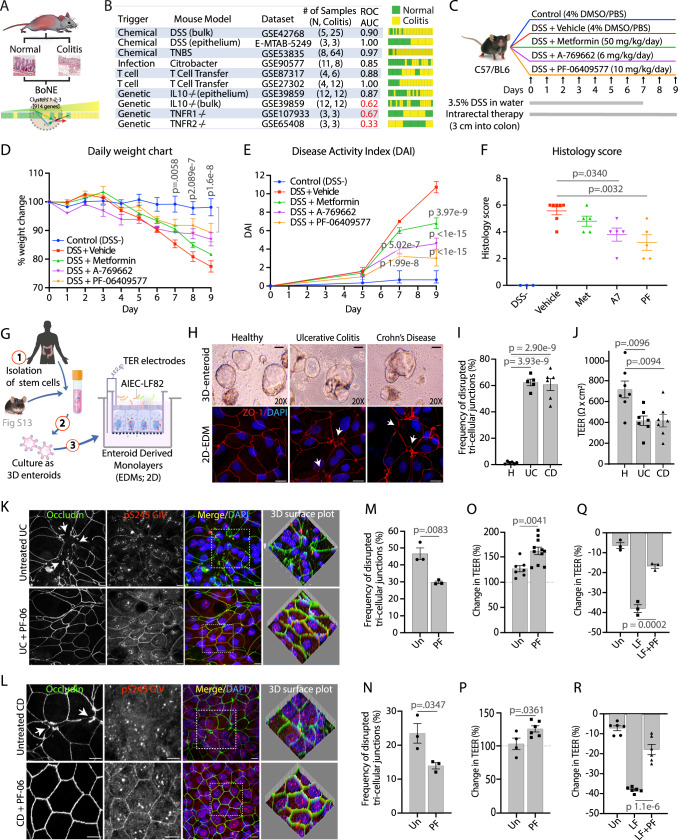
Fig. 4. Validation of PRKAB1-specific agonists in murine models of DSS-induced colitis and human organoid-microbe co-culture studies.
A, B Prediction of mouse colitis models relevant to human IBD. Computational workflow (A) for the prediction of mouse models of colitis that would be relevant for human IBD using BoNE. B Table (left) and bar plots (right) summarizing ROC/AUC analysis of various mouse models of colitis for their ability to model human IBD continuum using C#1-2-3 of the clustered Boolean implication network. Bulk = whole distal colon; epithelium = sorted epithelial cells. C Schematic outlining experimental design of DSS colitis model used to test the efficacy of multiple target-specific (PRKAB1-agonists PF-06409577 and A-769662) and non-specific (Metformin) drugs. The pharmacologic properties of each compound is summarized in Supplementary Fig. S11. D Line graph showing body weight change monitored daily during the course of acute DSS colitis. E Line graph of disease activity index (DAI) using stool consistency (0–4), rectal bleeding (0–4), and weight loss (0–4) as scoring criteria. F Scatter plot of histomorphological evaluation of inflammation by H&E stained colon tissues using inflammatory cell infiltrate (1–3), and epithelial architecture (1–3) as scoring criteria. For D–F n = 3–7 mice per group (DSS- n = 3, Vehicle n = 7, Met n = 5, A7 n = 5, PF n = 5). Extended histologic and immunohistologic analyses of colon tissue is presented in Supplementary Fig. S12. G Schematic of the stem cell-based organoid model and the generation of differentiated enteroid-derived monolayers (EDMs) for co-culture studies with microbes. Murine organoid studies are presented in Supplementary Fig. S13. H Light micrographs of human 3D enteroids (top row) and immunofluorescent micrographs of the TJ marker ZO-1 on human 2D enteroids (bottom row) isolated from healthy human colons or from colons of actively inflamed UC and CD patients. White arrowheads identify disrupted TJs. Scale bars are 100 µm and 10 µm in light micrographs and fluorescent micrographs, respectively. I Bar graph showing quantification of disrupted tri-cellular tight-junctions (TTJs) of healthy (n = 3), UC (n = 3), and CD (n = 3) patient-derived EDMs. J Bar graph of maximal absolute TEER values of UC and CD EDMs at ~48 h after EDM preparation when monolayers reach steady-state, as determined by two consecutive TEER reads that are similar (n = 3–5 reads/patient-derived organoid lines in 4I). K–R Immunofluorescent micrographs (K, UC; L, CD), a bar graph of quantification of TTJ disruption (M, UC; N, CD), and a bar graph showing the change in TEER (O, UC; P, CD) in patient-derived EDMs treated or not, with PF-06409577 (PF) for 16 h. All scale bars are 10 µm. Bar graph showing the change in TEER in UC (Q) and CD (R) patient EDMs treated, or not, with PF and exposed to LF-82 for 8 h. The frequency of disrupted TJs was calculated from 3 randomly chosen fields. See also Supplementary Fig. S14 for corresponding data in healthy patient-derived organoids. All TEER results were from 3 independent experiments. All data shown as mean ± S.E.M. and one-way ANOVA using Tukey’s multiple comparisons test and p ≤ 0.05 cutoff was used to determine significance. Source data are provided as a Source Data file.

