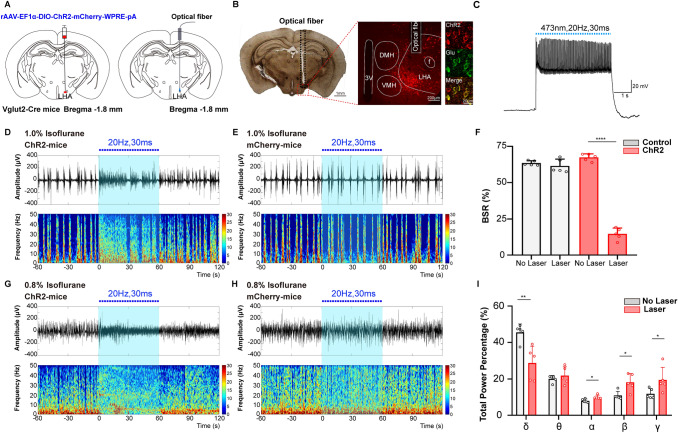
Fig. 3.
Optogenetic activation of LHA glutamatergic neurons reduces the depth of isoflurane anesthesia. A Schematic of excitatory optogenetic virus (ChR2) injection into the LHA in Vglut2-Cre mice. B Left, histological images of fiber location in the unilateral LHA; right, immunofluorescent staining showing the specificity of virus expression. C Ex vivo electrophysiology of ChR2 virus action in LHA glutamatergic neurons. D, E Representative EEG traces (above) and corresponding power spectra (below) before, during, and after 1 min optical activation under 1.0% isoflurane anesthesia in the ChR2 group (D) and the Control group (E). F Statistics of the change of BSR before and during optical stimulation. G, H Changes of EEG traces (above) and corresponding power spectra (below) in the ChR2 group (G) and the Control group (H) under 0.8% isoflurane anesthesia. I Comparison of the spectral power percentage for 1 min before and after optical activation in the two groups. Data are shown as the mean ± standard deviation, n = 5 per group; *P <0.05, **P <0.01, ****P <0.0001 vs control group; BSR, burst-suppression ratio; f, fornix; LHA, lateral hypothalamic area; DMH, dorsomedial hypothalamic nucleus; VMH, ventromedial hypothalamic nucleus; 3V, third ventricle.

