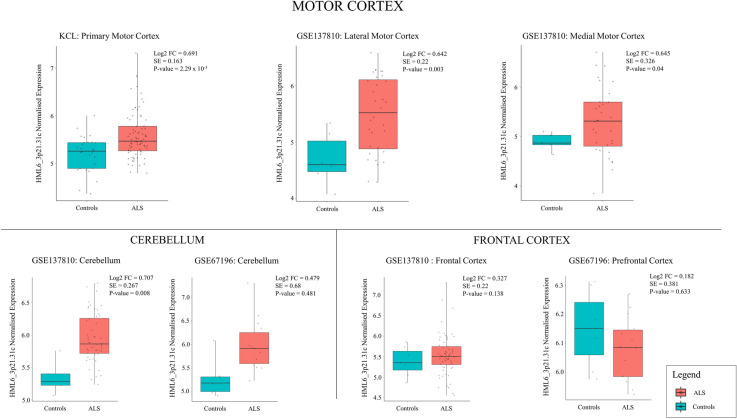
Figure 1.
Jitter boxplots comparing HML6_3p21.31c expression between ALS and controls across seven post-mortem RNA-sequence datasets. We found increased expression of HML6_3p21.31c in all motor cortex and cerebellum cohorts, but not in the frontal cortex tissue. X-axes: Disease status. Y-axes: Normalised expression of HML6_3p21.31c. Dots: HML6_3p21.31c expression for each sample. Boxplot: Boxplot of the distribution of HML6_3p21.31c. Boxplot colour: Disease status (ALS: Red; Control: Blue). Figure titles: Data source and tissue. Log2 FC: Log2 Fold-change, SE: Standard error, p value: Derived from differential expression analysis.

