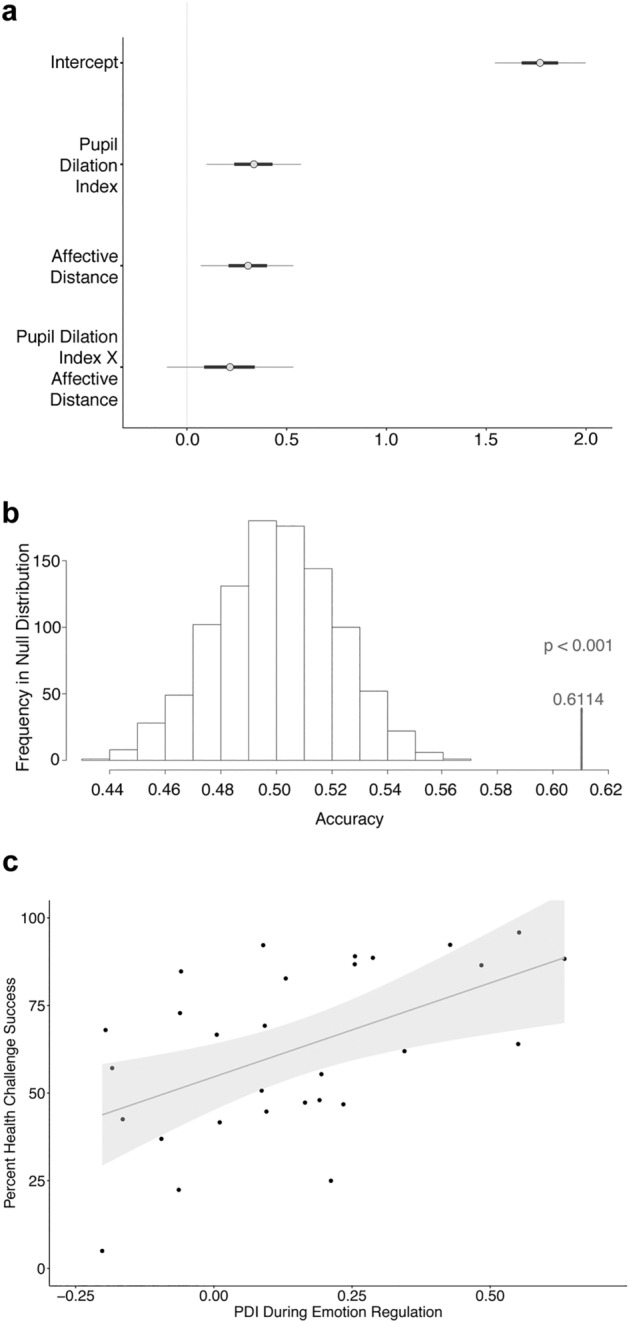
Figure 3.

Predictive and convergent validity of the Pupil Dilation Index for self-regulation success. (a) Bayesian linear regression of self-regulation success using the model given in Eq. (3a). Pupil Dilation Index denotes the coefficient estimating the influence of regulation-related arousal components. Affective Distance denotes the coefficient estimating the influence of the mean absolute difference of the view rating from neutral (middle of the rating scale) that can be interpreted as a proxy for regulation difficulty. Regulation success increased both with greater Pupil Dilation Index and Affective Distance. The plot shows the mean beta estimates (grey dots) as well as the range of coefficients within the 90% credible interval) that is shown by the light grey horizontal bars (thick horizontal bars = 50% credible interval). (b) Predicting regulation success out-of-sample. The results from the model in Eq. (3a) were cross-validated with a Leave-2-Participants-Out approach. Based on data from N-2 participants, we predicted which of the two left-out individuals regulated more successfully. The model predicted with 61% accuracy significantly above chance (p < 0.001). (c) Convergent validity of the Pupil Dilation Index. The Pupil Dilation Index (PDI) that we measured during emotion regulation also shows convergent validity across different types of self-control tasks: a higher PDI value was associated with higher health challenge success scores within-individual in the dietary health challenge task that individuals completed in the same experimental session (r = 0.51, posterior probability rho > 0 = 0.9995), explaining 26% of the variance (R-squared = 0.26) in dietary health challenge success. The grey shaded area signifies the 95% confidence interval.
