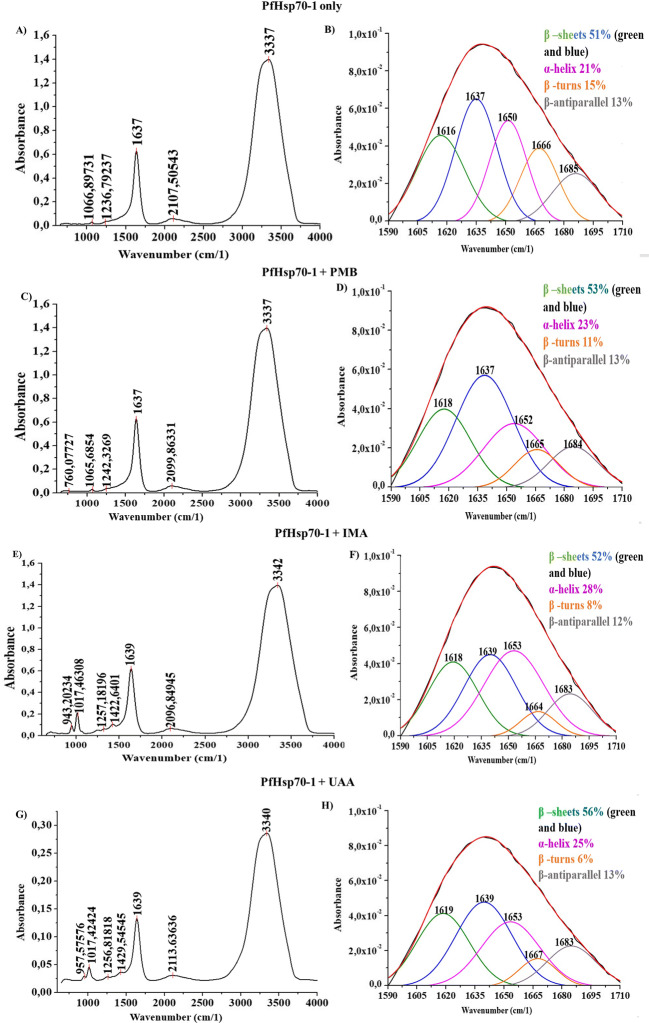
Fig. 5.
FTIR spectra of PfHsp70-1-compound interaction. The image shows FTIR analysis for: native PfHsp70-1 only, PfHsp70-1 incubated with 1 mM polymyxin B, PfHsp70-1 incubated with 1 mM iso-mukaadial acetate and 1 mM ursolic acid acetate. Spectrum images labelled as fitted curve of amide band I at 1600–1700 cm−1 (B, D, F and H), whereas amide band peaks between 400 and 4000 cm−1 (A, C, E and G) representing secondary structure distribution

