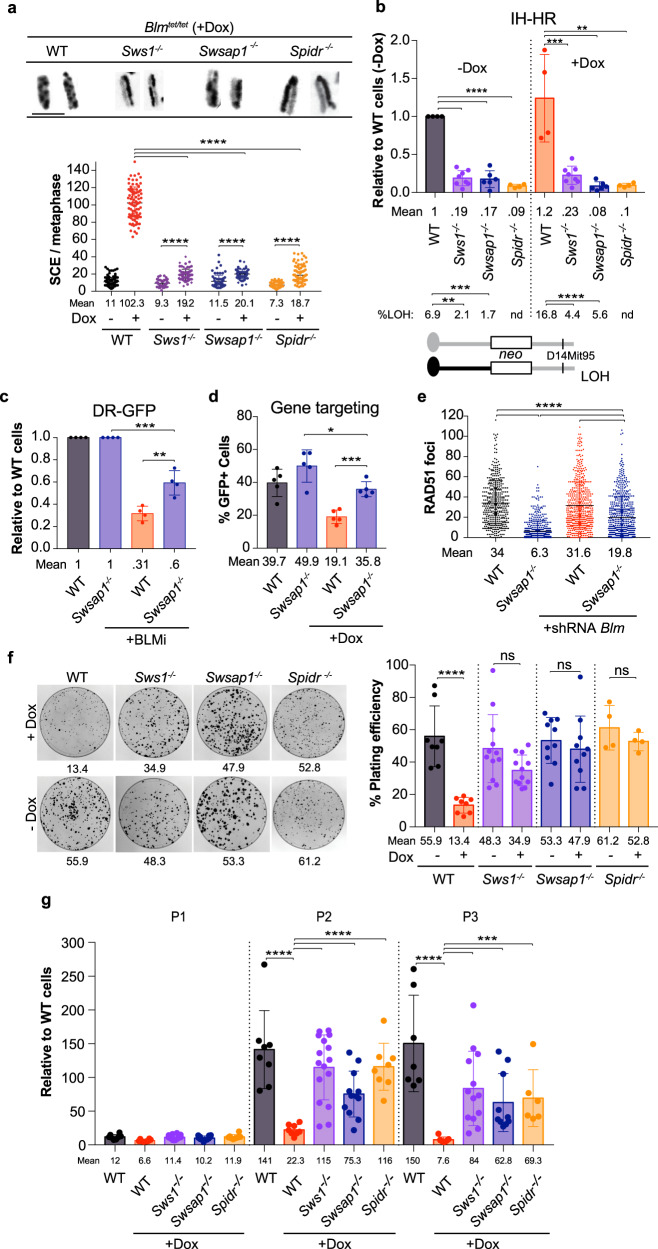
Fig. 3. Mitotic phenotypes associated with BLM depletion are dramatically ameliorated by loss of SWS1–SWSAP1–SPIDR.
a. Loss of SWS1–SWSAP1–SPIDR substantially reduces SCEs in BLM-depleted ES cells. Representative metaphase chromosomes showing SCEs are shown on the left with quantification upon BLM depletion on the right. Blmtet/tet cells that otherwise wild-type or mutated for Sws1, Swsap1, or Spidr are treated with Dox (1 μM) to deplete BLM. While BLM depletion alone in Blmtet/tet cells increases SCEs ~nine-fold, BLM depletion in Sws1−/− Blmtet/tet, Swsap1−/− Blmtet/tet, or Spidr−/− Blmtet/tet cells increases SCEs only by ~2 fold. WT-dox n = 7, WT + dox n = 7, Sws1−/− -dox n = 5, Sws1−/− +dox n = 5, Swsap1−/− -dox n = 4, Swsap1−/− +dox n = 4, Spidr−/− -dox n = 5, Spidr−/− +dox n = 5, where n is the number of independent experiments. (See also Supplementary Fig. 9a). b IH-HR in SWS1–SWSAP1–SPIDR mutant ES cells is not further decreased upon BLM depletion, however, LOH of a marker distal to the neo locus (D14Mit95) is reduced in neo+ clones (p < 0.0001), presumably due to reduced crossing over. nd, not determined. Relative to WT cells, colony counts expressed relative to wild-type cells transfected with an empty vector within each experiment. WT-dox n = 4, WT + dox n = 4, Sws1−/− -dox n = 8, Sws1−/− +dox n = 8, Swsap1−/− -dox n = 6, Swsap1−/− +dox n = 6, Spidr−/− -dox n = 4, Spidr−/− +dox n = 4, where n is the number of independent experiments. (See also Supplementary Fig. 9b). c BLM inhibition in wild-type ES cells reduces HDR in the DR-GFP reporter, however, HDR is partially restored in Swsap1−/− cells treated with the inhibitor (BLMi: ML216, 50 µM). Relative to WT cells, % GFP + expressed relative to wild-type cells transfected with an empty vector within each experiment. n = 4, where n is the number of independent experiments. d BLM depletion in Blmtet/tet ES cells reduces DSB-induced gene targeting at the Hsp90 locus, however, gene targeting is partially restored in Swsap1−/− Blmtet/tet cells. n = 5, where n is the number of independent experiments. e RAD51 focus formation in Swsap1−/− primary MEFs is increased when BLM is depleted. Cells were treated with 10 Gy IR. Scale bar, 10 µm. n = 3, where n is the number of independent experiments. (See Supplementary Fig. 9c for SCE analysis when BLM is depleted.). f Colony formation is reduced by three to four-fold upon BLM depletion; however, it is restored in BLM-depleted Sws1−/−, Swsap1−/−, and Spidr−/− ES cells. The numbers shown below each plate indicate the plating efficiency (%). n = 8, where n is the number of independent experiments. (See also Supplementary Fig. 9d). g Population doubling experiments show reduced ES cell numbers with BLM depletion at passages 2 and 3, which can be significantly restored in the absence of SWS1, SWSAP1, and SPIDR. Relative to WT cells, cell counts expressed relative to wild-type cells within each experiment. n = 6, where n is the number of independent experiments. (See also Supplementary Fig. 9e) Error bars in a–g, mean ± s.d. *P ≤ 0.05; **P ≤ 0.01; ***P ≤ 0.001; ****P ≤ 0.0001; unpaired t test, two-tailed. All source data are provided in the source data file.

