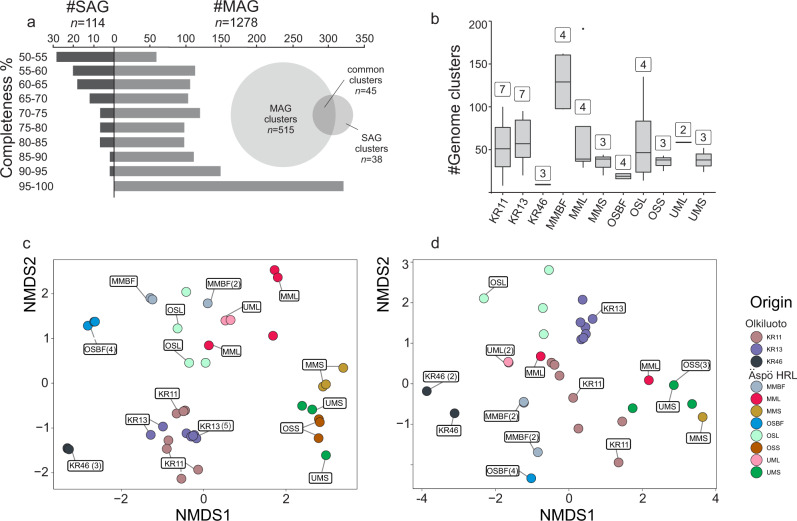
Fig. 1. Overview of the FSGD MAGs and SAGs.
Statistics of the metagenome-assembled genomes (MAGs) and single-cell amplified genomes (SAGs) of the Fennoscandian Shield Genomic Database (a). The number of genome clusters present in borehole samples (centerline, median; hinge limits, 25 and 75% quartiles; whiskers, 1.5x interquartile range; points, outliers). Numbers on top of each box plot represent the number of metagenomes generated for borehole samples (b). NMDS plot of unweighted binary Jaccard beta-diversities of presence/absence of all FSGD reconstructed MAGs/SAGs (c) and MAG and SAG clusters belonging to the common core microbiome present in both Äspö HRL and Olkiluoto (d). Numbers in the parenthesis show the number of overlapping points. The data used to generate these plots are available in Supplementary Data 4 and the Source Data.

