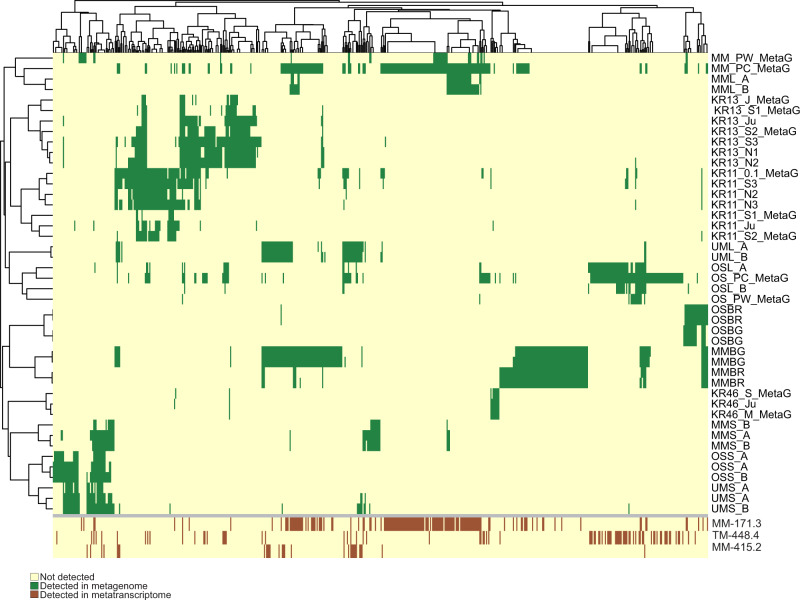
Fig. 3. Distribution pattern and transcription status of the FSGD genome clusters along different metagenomes and metatranscriptomes.
Each column represents a genome cluster of reconstructed MAGs/SAGs of the deep groundwater datasets of this study. The top heatmap depicts the presence (colored in green) of each genome cluster along metagenomics datasets originating from different boreholes of the two sampled sites. The bottom heat map represents the transcription status of the genome cluster representatives in the metatranscriptomes originating from different boreholes of the Äspö HRL (brown). Clusters with all zero values have been removed from the plot (in total 14 clusters that are solely represented by SAGs).

