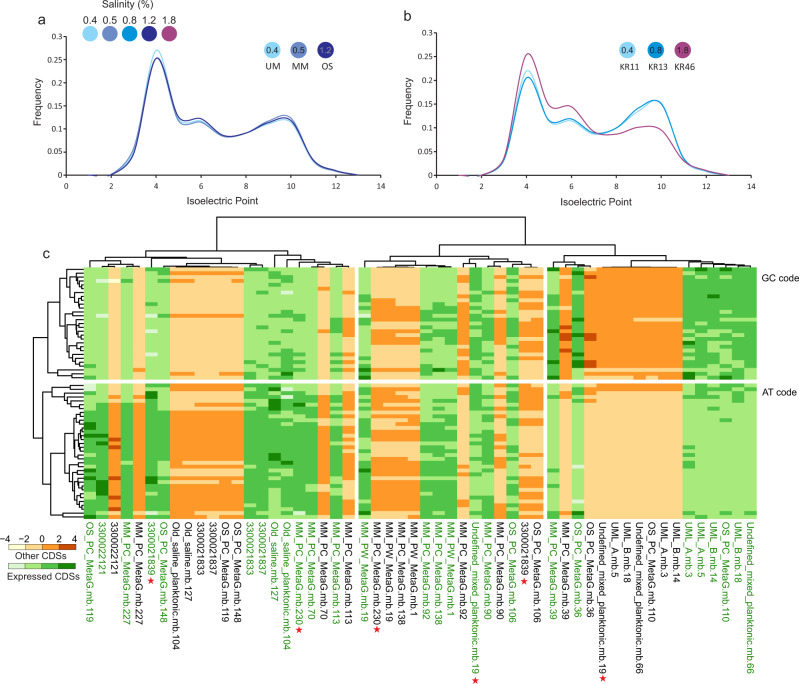
Fig. 4. Adaptations of the coding sequences of the deep groundwater microbiome.
Relative frequency of isoelectric points in the predicted proteins of assembled metagenomes from Äspö HRL boreholes (a) and Olkiluoto (b). Data used to generate these plots are available in the Source Data. The salinity of the water flowing in each borehole is shown on the top left legend. Representation of frequency (the expected number of codons, given the input sequences, per 1000 bases) of the utilization of synonymous codons across MAGs and SAGs of different genomes clusters of highly expressing Desulfobacterota. Codon usage frequencies are calculated separately for the CDSs for which RNA transcripts are detected (green) and the rest of CDSs not actively being transcribed in the sequenced metatranscriptomes (orange) (c). Stars showcase potential transcription efficiency control via codon usage bias.

