
Figure 1.
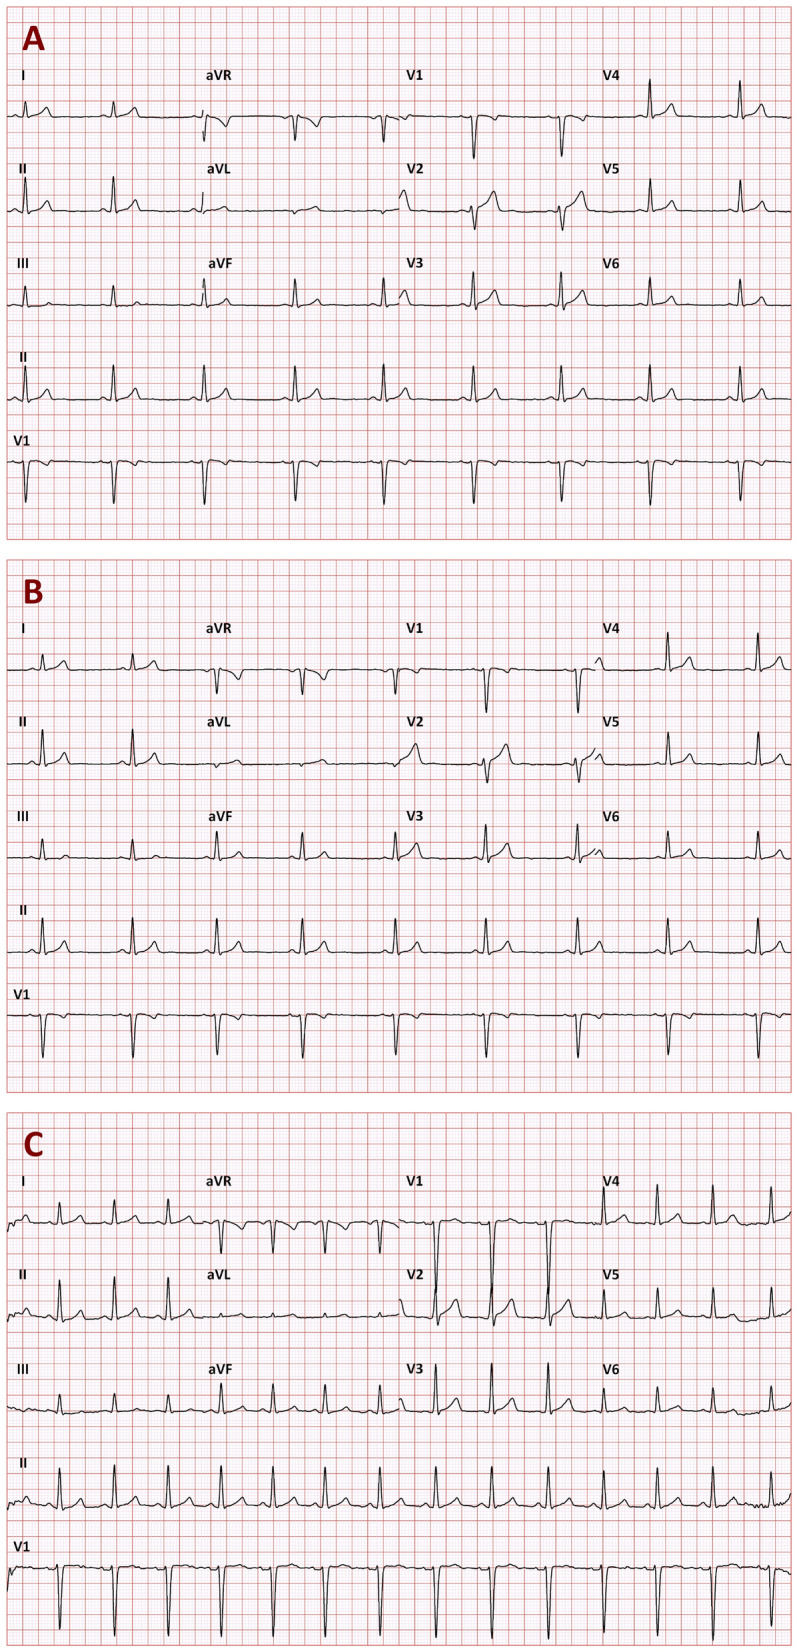
Example of three 10-s ECGs recorded in a 30-year old male in a short succession while the subject was kept in a strict motionless position. On the baseline drug-free day, the recordings A, B, and C were recorded at 13:34:38, 13:34:58, and 13:35:28, respectively. Their 10-s heart rates were 52.7, 52.6, and 85.9 bpm, and their uncorrected QT intervals were 405, 405, and 395 ms, respectively. When individual QT/RR hysteresis profile was incorporated into the assessment, the heart rates underlying the QT interval duration were 53.6, 53.4, 58.3 bpm which led to individually corrected QTcI intervals of 391.0, 390.7, and 391.5 ms, respectively. However, when the 10-s heart rates were used to correct the QT intervals, Bazett correction led to QTc values of 379.4, 379.2, and 472.7 ms, respectively (92 ms QTc increase). Fridericia correction let to QTc values of 387.7, 387.6, 445.2 ms, respectively (58 ms QTc increase). These QTc increases were erroneous since they resulted from the disassociation of the QT interval duration from the underlying heart rate. Similar erroneous QTc increases were found with all the investigated corrections formulas (QTc increase of 74, 58, 81, 48, 74, 62, 60, and 61 ms for the Dmitrienko, Framingham, Schlamowitz, Hodges, Ashman, Rautaharju, Sarma, and Rabkin corrections, respectively).