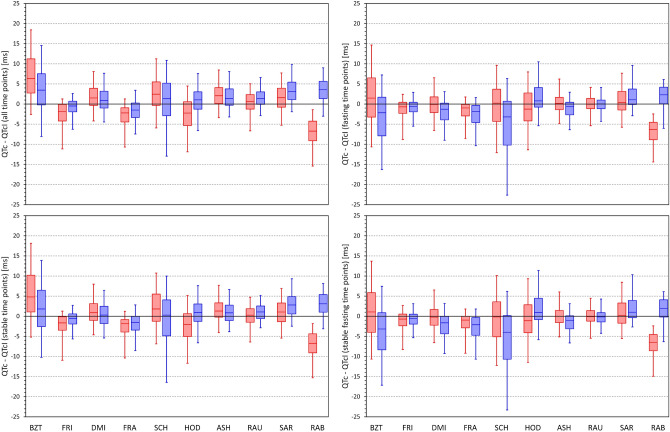
Figure 12.
Distribution of the mean intra-subject differences between QTc intervals by different correction formulas and the corresponding QTcI values. The distribution of the differences is shown for calculations over all study time-points (top left panel), time-points with stable heart rate (bottom left panel), morning fasting time-points (top right panel), and morning fasting time-points with stable heart rate (bottom right panel). The layout of the panels and the meaning of the box and whisker graphs is the same as in Fig. 8. ms milliseconds.

