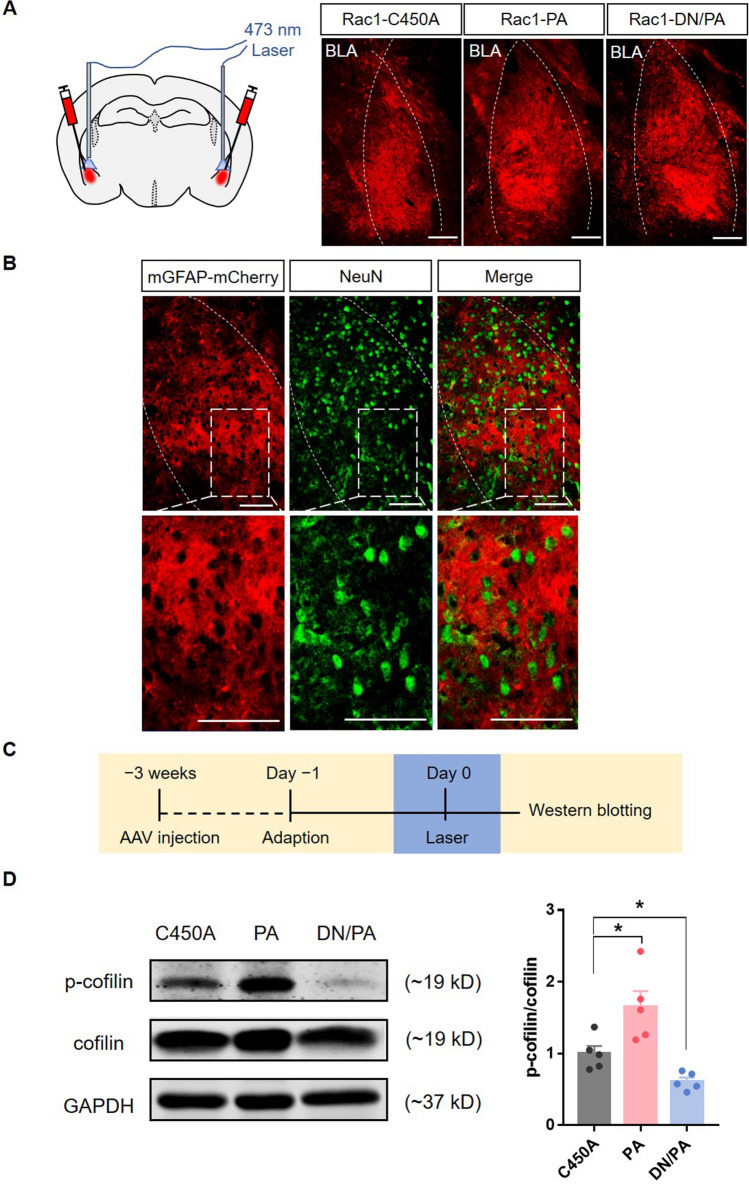
Fig. 2.
Efficiency tests for Rac1-PA, Rac1-DN/PA, and Rac1-C450A. A Schematic of laser stimulation of the bilateral BLA (left) and representative images of Rac1-C450A-mCherry, Rac1-PA-mCherry, and Rac1-DN/PA-mCherry expression in the BLA (right) (dotted lines, location of the BLA; scale bars, 100 μm). B Representative immunofluorescence images showing that few (2.49% ± 0.26%) neurons (NeuN+, green) are co-labeled with AAV-GFAP-mCherry, indicating that the expression of LOV-Rac1 is restricted to astrocytes (scale bars, 100 μm). C Diagram of the experiment timeline. Three weeks after virus injection, the mice received 15-min laser (473 nm) stimulation and were anesthetized immediately for Western blotting. D Laser stimulation of Rac1-PA increases the expression levels of p-cofilin, while laser stimulation of Rac1-DN/PA decreases its levels (Rac1-C450A: n = 5, Rac1-PA: n = 5, Rac1-DN/PA: n = 5; *P < 0.05, C450A vs PA, C450A vs DN/PA, one-way ANOVA).

