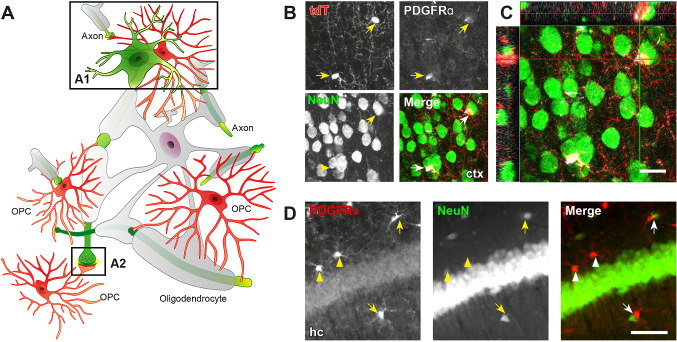
Fig. 3.
Synaptic and non-synaptic neuron-OPC communication. A Schematic of neuron-OPC communication in the brain, including direct soma-soma (A1) and synaptic contact (A2). B–D OPC somata (PDGFRα+, red) are in close contact with neuronal somata (NeuN+, green) (arrows) in cortex (ctx, B and C) and hippocampus (hc, D). Micrographs in B and C are from the cortex of NG2-CreERT2 × Rosa26-CAG-lsl-tdTomato mice [6, 133]. Images were acquired by confocal laser-scanning (LSM710, B and C) or automated epifluorescence microscopy (AxioScan.Z1) (D) with appropriate filters and objectives. Scale bars, 20 μm for B and 50 µm for D.

