
Figure 6.
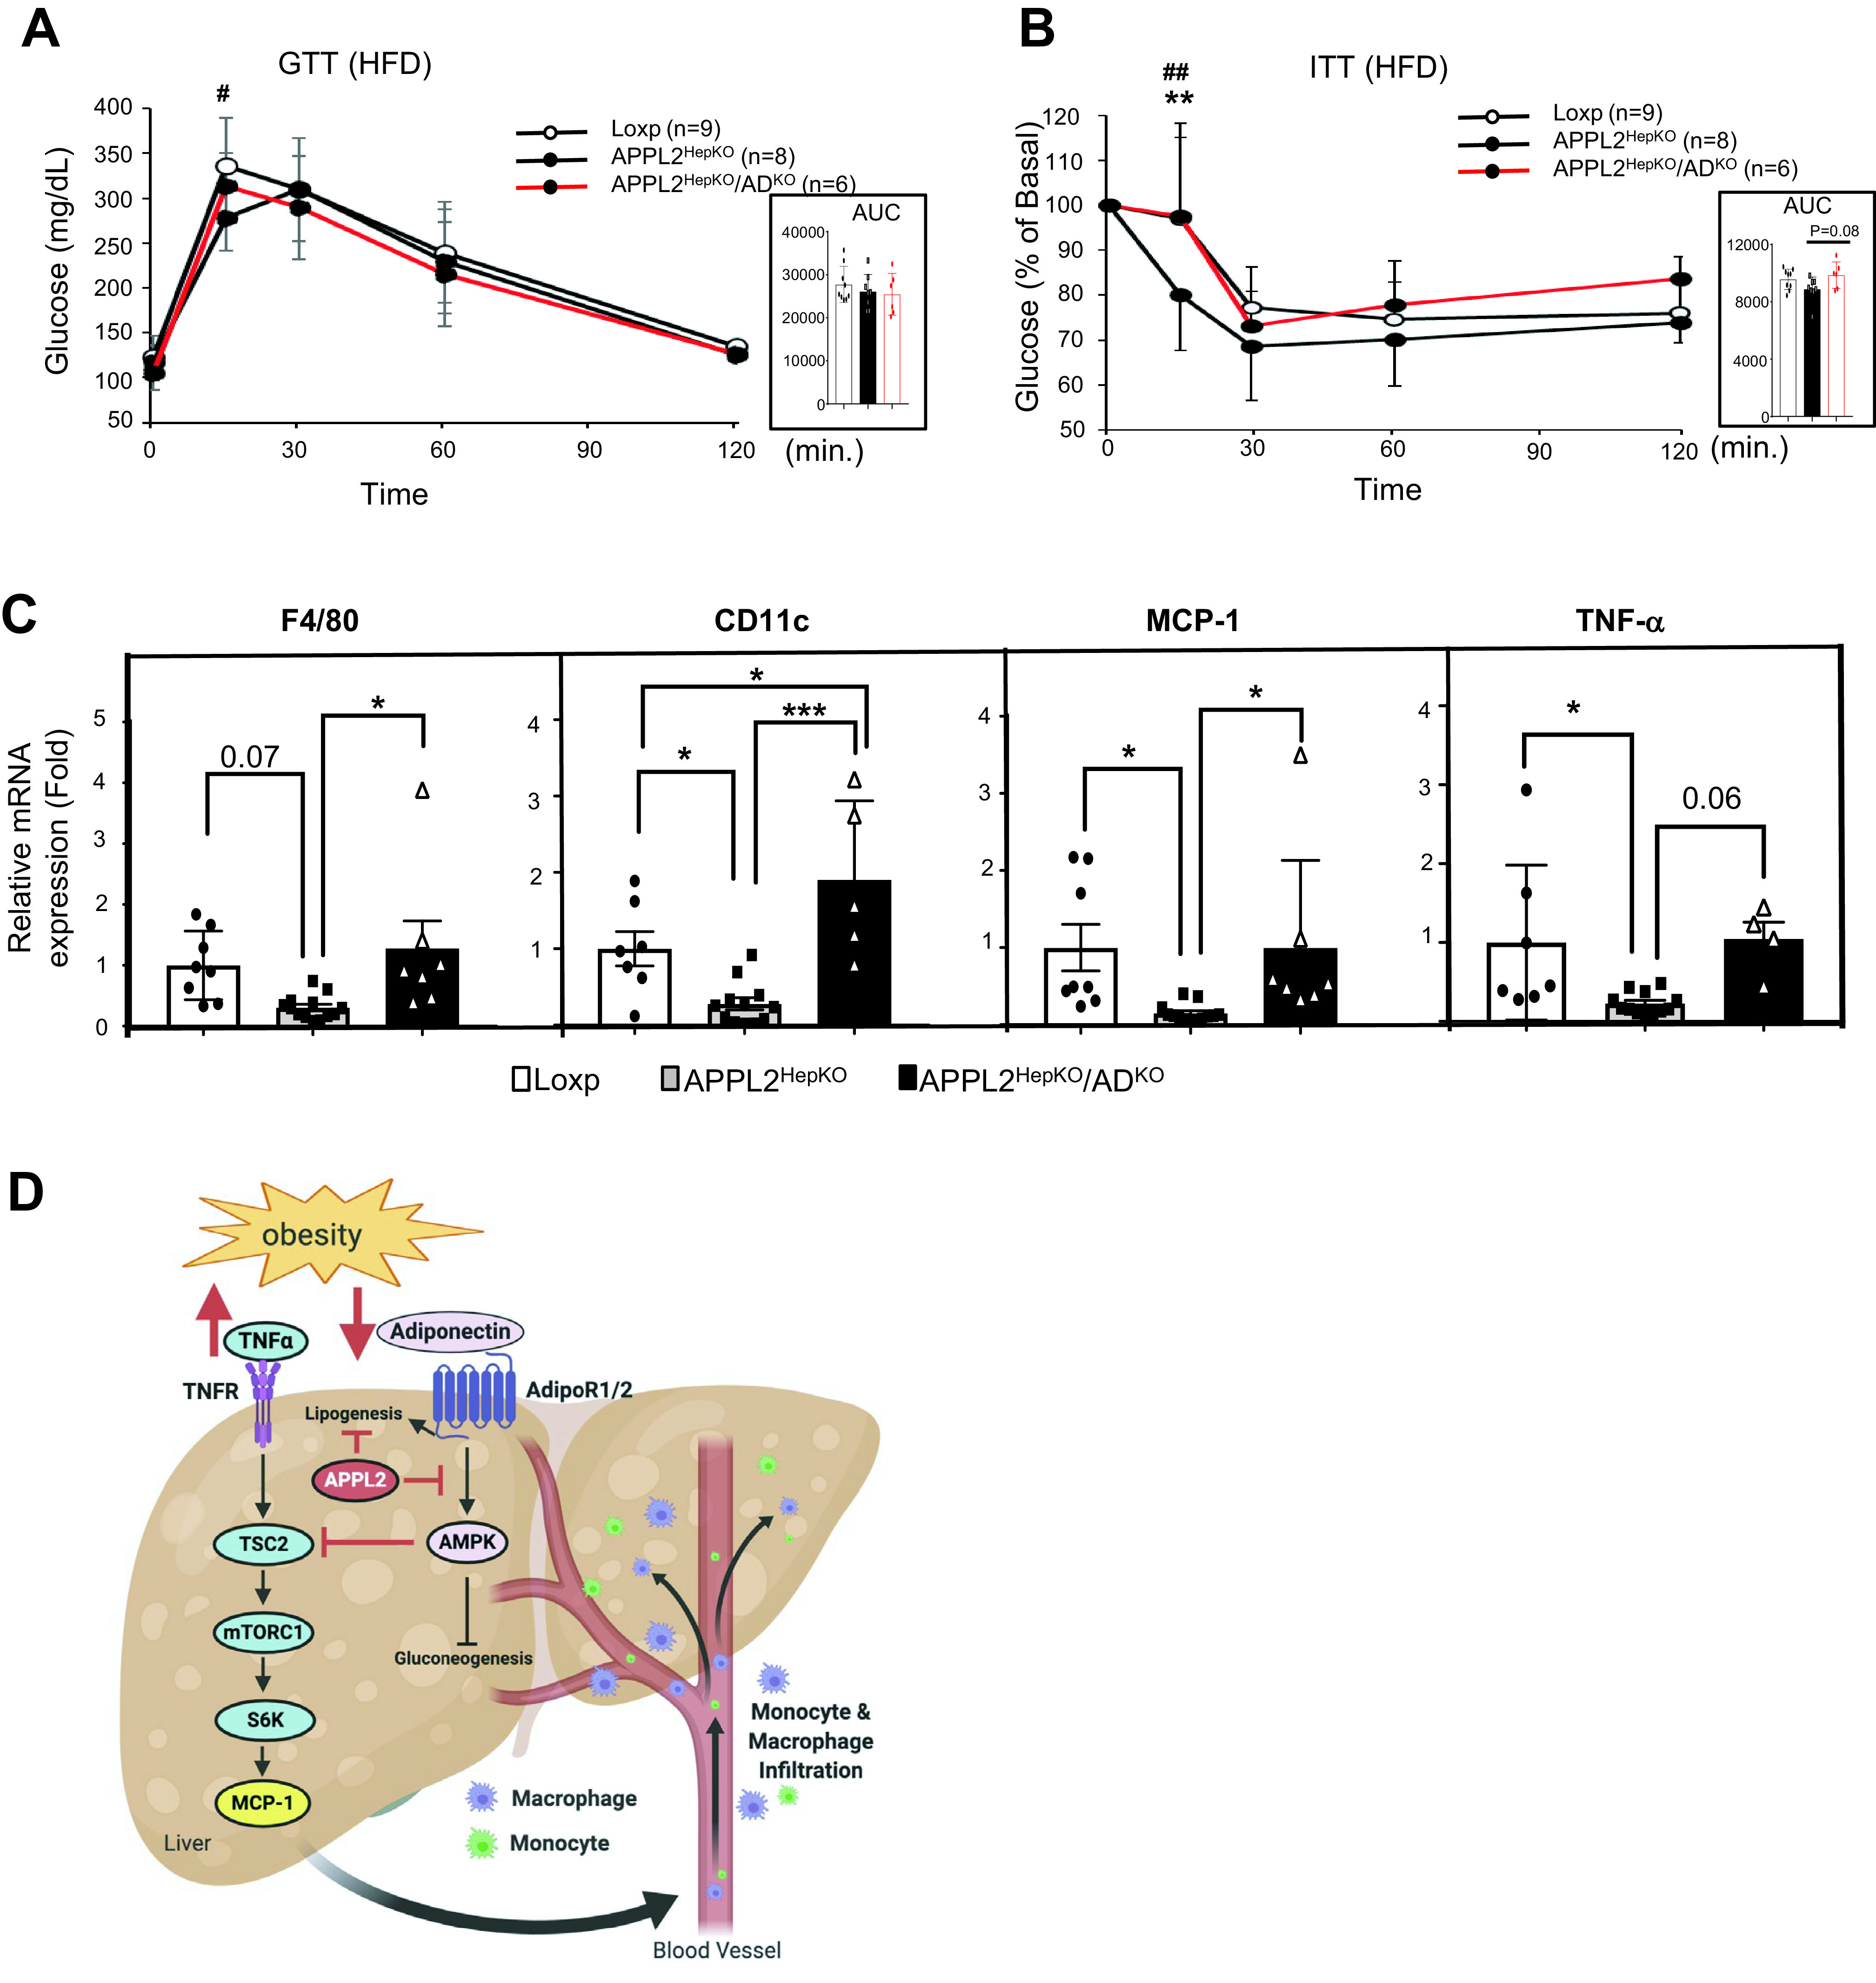
Deletion of the adiponectin gene in APPL2HepKO mice reverses the anti–insulin resistance and anti-inflammation phenotypes. A: Glucose tolerance test (GTT) with APPL2HepKO and APPL2HepKO/AdKO mice under HFD (*P < 0.01, Loxp vs. APPL2HepKO). B: Insulin tolerance test (ITT) (**P < 0.001, Loxp vs. APPL2HepKO; ##P < 0.001, APPL2HepKO vs. APPL2HepKO/AdKO). C: mRNA expression of M1 macrophage–related genes in the mouse livers. D: Schematic diagram to demonstrate the mechanism by which hepatic adiponectin signaling prevents diet-induced hepatic inflammation and insulin resistance in liver tissue. Figure created with BioRender (biorender.com). All results are presented as mean ± SD, and P values were calculated with use of two-way ANOVA, for A and B, or one-way ANOVA, for C (*P < 0.05 and ***P < 0.001). AUC, area under the curve.