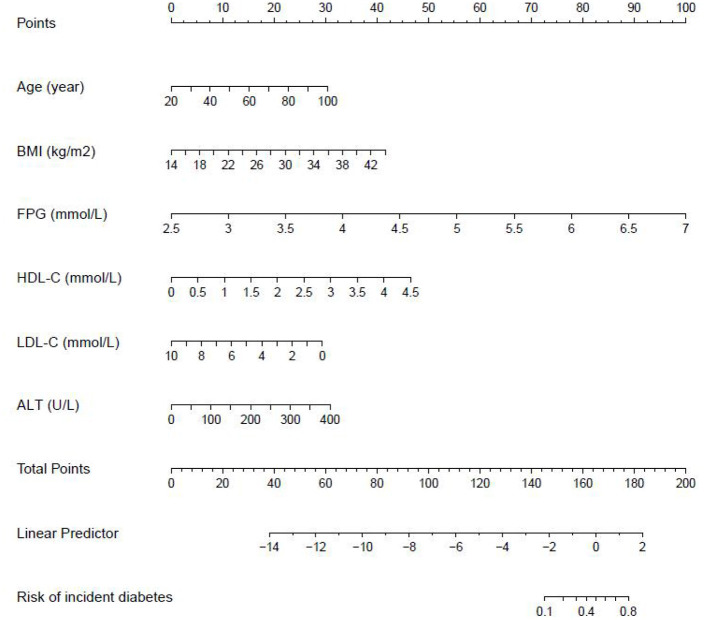
Figure 4.
The nomogram of the stepwise model to predict the 3-year risk of incident diabetes. When predicting an individual's 3-year risk of diabetes, locate his/her value on each variable axis. Draw a vertical line from that value to the top Points scale to determine how many points are assigned by that variable value. Then, the points from each variable value are summed. Locate the sum on the Total Points scale and vertically project it onto the bottom axis, thus obtaining a personalized 3-year risk of diabetes.

