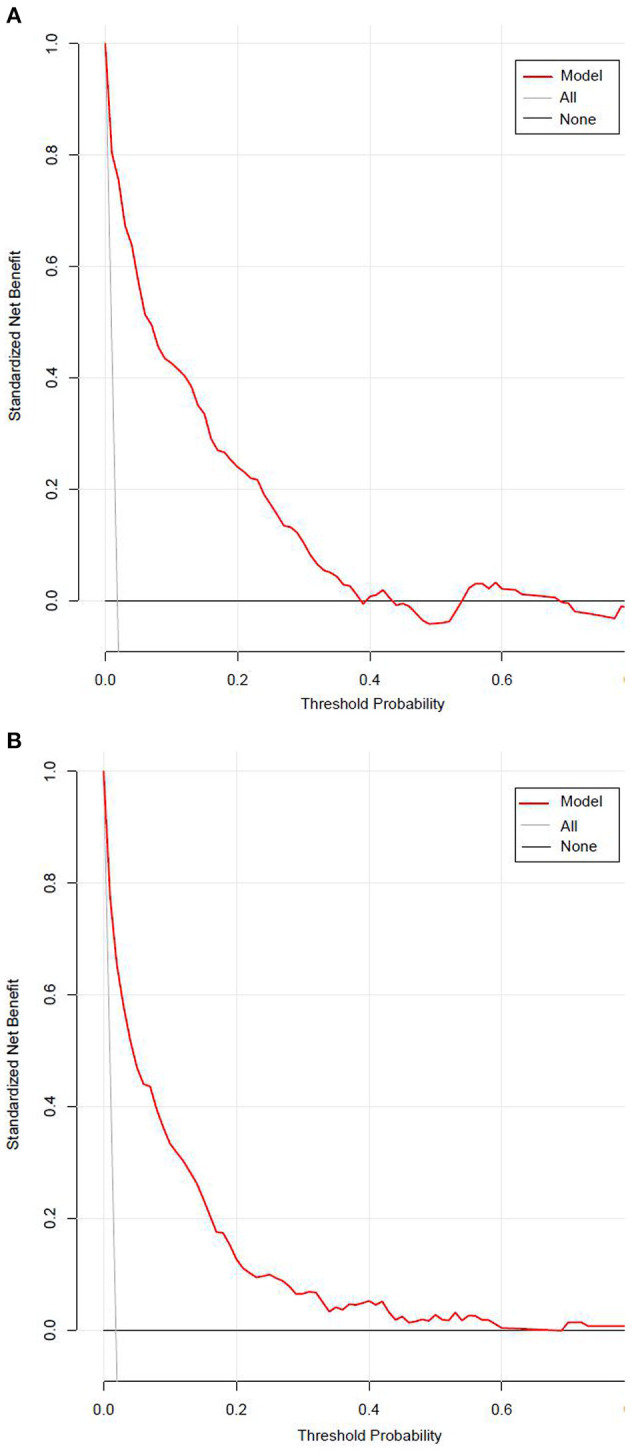
Figure 7.

The decision curve for the stepwise model predicts the risk of incident diabetes in the training set (A) and validation set (B). Net benefit is shown on the y-axis. The red line represents the model; the thin gray line represents the assumption that all participants develop diabetes; the thin black line represents the assumption that none participants develop diabetes. The decision curve demonstrated that if the threshold probability of a patient is >1%, using the model to predict incident diabetes adds more benefit than diabetes screenings (i.e., oral glucose tolerance test) for all or none of the participants.
