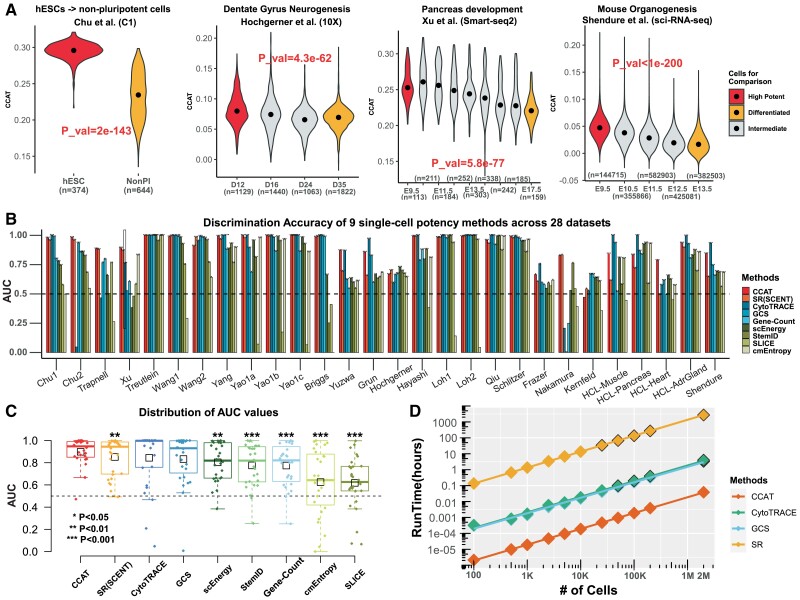
Fig. 1.
Evaluation and benchmarking of CCAT. (A) Distribution of CCAT single-cell potency measure as a function of cell-type or developmental/differentiation timepoint for four independent scRNA-Seq studies. Groups labeled in red and orange denote the cell-types that ought to differ in terms of differentiation potency, with groups labeled in gray denoting intermediate stages. P-value is from a one-tailed Wilcoxon rank sum test comparing the higher potency group (red) to the lower potency one (orange). Number of cells in each group is given below violin plots. (B) The discriminative accuracy (AUC) derived from the Wilcoxon rank sum test, displayed for 9 different single-cell potency methods across 28 independent scRNA-Seq studies. (C) Distribution of the AUC values in (B) for each of the nine single-cell potency estimation methods. Each boxplot contains 28 datapoints represent the 28 studies. Methods have been ranked according to the mean AUC over the 28 studies, indicated by the small black boxes. P-values derive from a paired one-tailed Wilcoxon rank sum test comparing the AUC of CCAT to each of the other methods, i.e. with the alternative hypothesis that the AUC for CCAT is higher. We only mark significant P-values as shown. P-values for the other alternative, i.e. that the AUC of each other method is higher than that of CCAT were all non-significant (P > 0.05). (D) Run times (y-axis) against the number of cells in a scRNA-Seq study for four different methods, as indicated. Run times were obtained on an Intel Xeon E3-1575M v5/3 GHz and using only 1-core. If run in parallel, say 100 cores, run times can be approximated by dividing values in panel by 100. Data points with black borders were estimated from a linear regression fit

