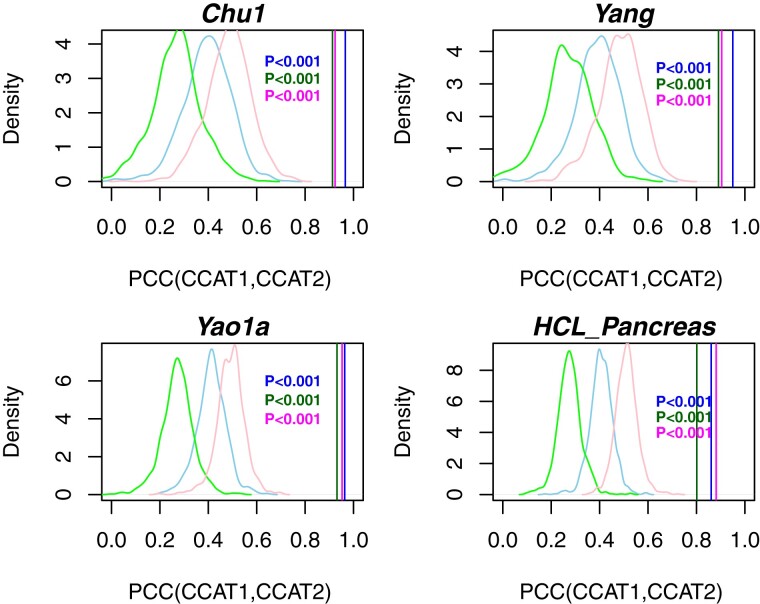
Fig. 4.
Statistical significance of CCAT correlations. For each of four scRNA-Seq studies (Chu1, Yang, Yao1a and HCL-Pancreas), we compare the Pearson correlation of CCAT values between each pair of PPI network, denoted PCC(CCAT1, CCAT2) (3 vertical lines), to the null distribution (density curves) obtained by permuting the degree distribution of each network (1000 Monte-Carlo runs). Colors label the different pairs of PPI networks: blue (PC1-PCv12), green (PC1-STRING), magenta (PCv12-STRING). Empirical P-value is given

