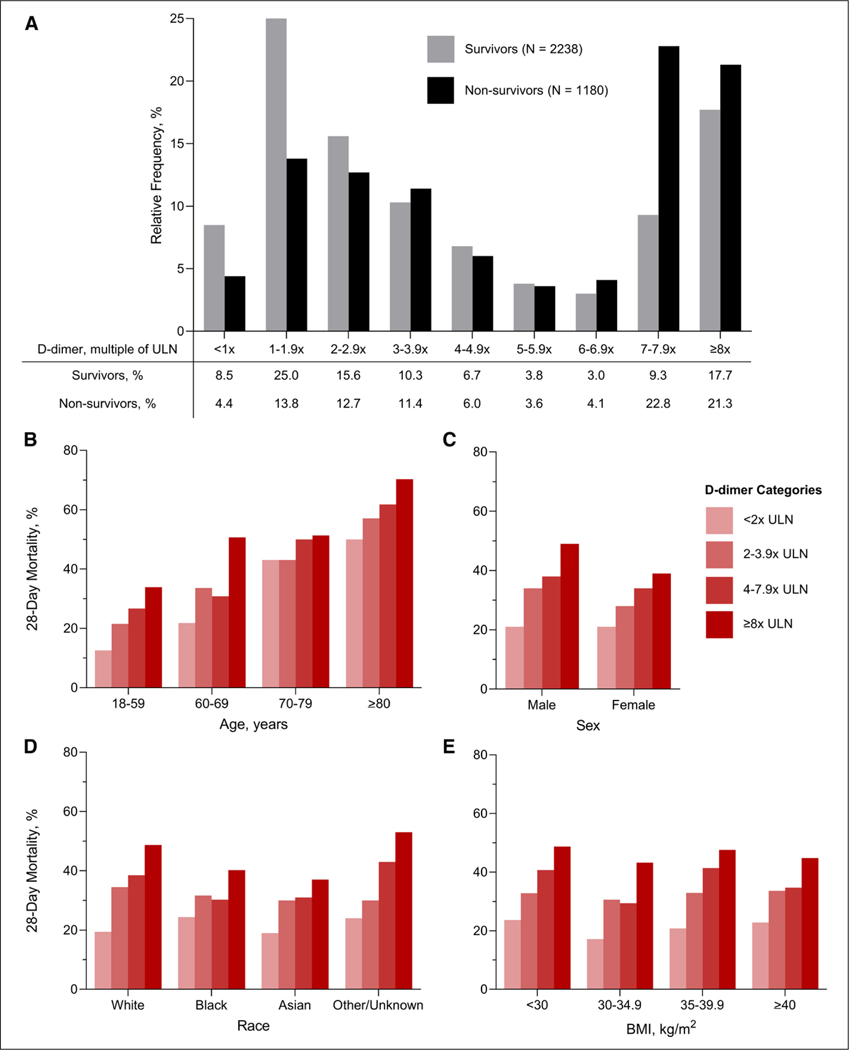
Figure 1.
D-dimer distribution and correlates with mortality. A, The relative frequencies of D-dimer levels, defined as the highest value measured within two days following ICU admission, by 28-day mortality status. B-E, Correlation of D-dimer categories with death by age, sex, race, and body mass index (BMI) categories, respectively. ULN = upper limit of normal.

