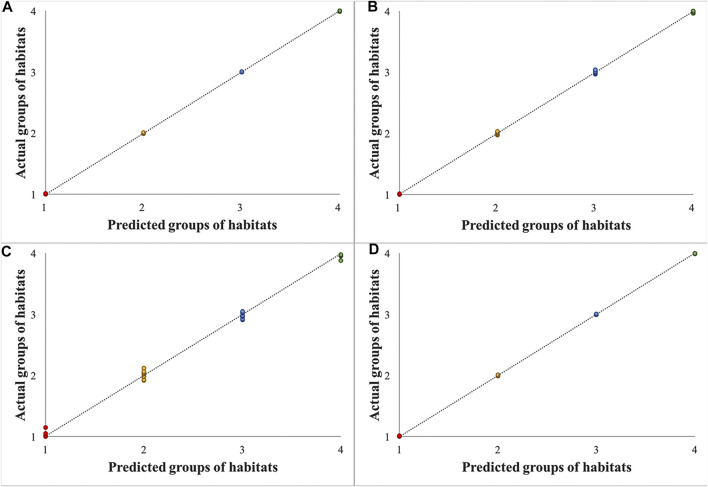
FIGURE 5.
Results of partial least square (PLS) regression models for samples of the dried root of Isatis indigotica from four habitats based on mass spectrometry imaging (MSI) data in the spectral ranges of m/z 100–500 in a positive mode (A), m/z 500–1,000 in a positive mode (B), m/z 100–500 in a negative mode (C), and m/z 500–1,000 in a negative mode (D).

