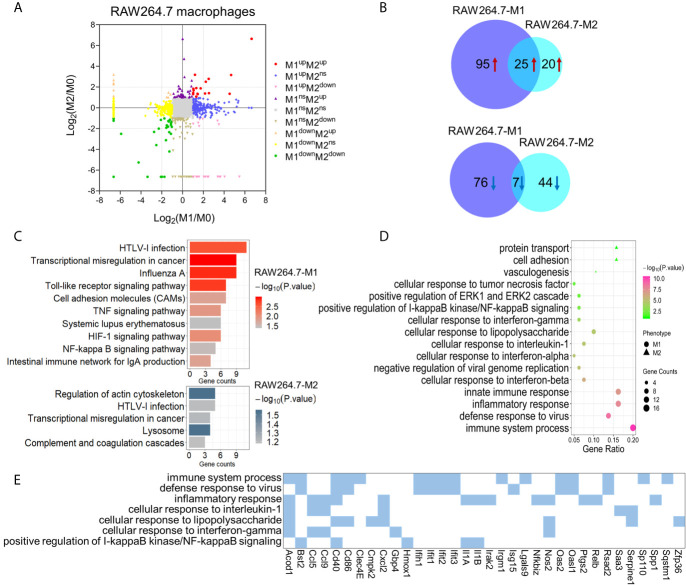
Figure 3.
Identification and bioinformatic analysis of differentially expressed proteins from M1 and M2 types of polarized mouse RAW264.7 macrophages. (A) Scatter plot showing the distribution of differentially expressed proteins in M1 and M2 polarized macrophages, compared to the M0 macrophages. (B) Venn diagram of differentially expressed proteins between two types of polarized macrophages. Upper: up-regulated; lower: down-regulated. (C) KEGG pathway analysis of differentially expressed proteins in M1 (upper) and M2 (lower) macrophages from mouse RAW264.7 cells. (D) Gene ontology enrichment analysis (biological process) of up-regulated proteins in M1 and/or M2 phenotypes. (E) The enriched biological processes corresponding to the up-regulated proteins in M1 macrophages.

