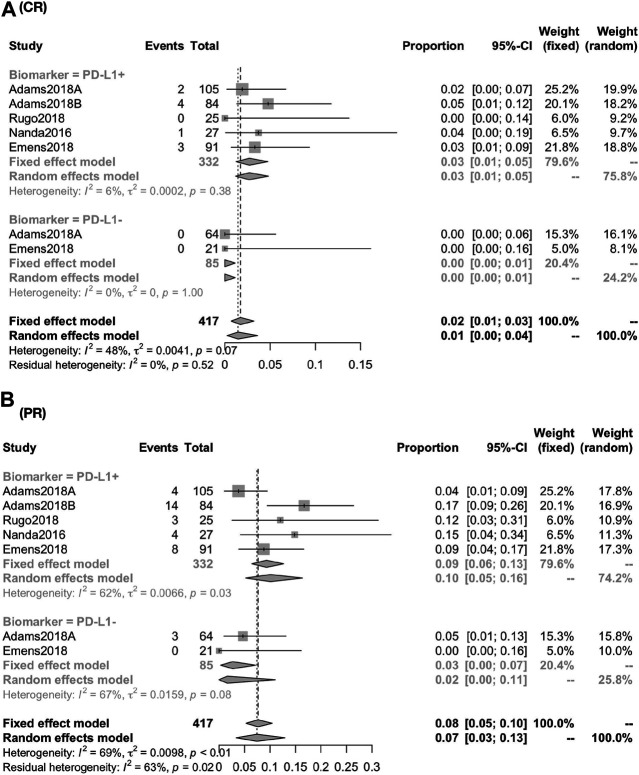
FIGURE 3.
Global response rate between PD-1+ and PD-L1− for patients of CR (A) and PR (B). The response rate was closely associated with the expression of PD-L1 biomarker (PD-L1+ vs. PD-L1−): the CR was 2.71% (95% CI, 1.24–4.72; I2, 05.00) vs. 0.00% (95% CI, 0.00–1.13; I2, 00.00); the PR was 9.93% (95% CI, 4.85–16.37; I2, 61.60) vs. 2.69% (95% CI, 0.01–8.03; I2, 66.70).

