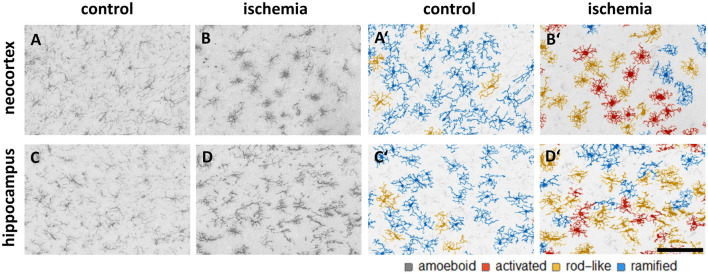
Figure 6.
Representative images of Iba1 staining within the control neocortex (A), ischemic neocortex (B), control hippocampus (C), and ischemic hippocampus (D) on the left side, and the appropriate microglial cell segmentation on the right side (A′–D′). Ramified microglia are depicted in blue, rod-like cells in orange, and activated microglial cells in red. Amoeboid microglial cells are not present in the depicted sections due to their low occurrence (n = 80; see Supplementary Table 2).

