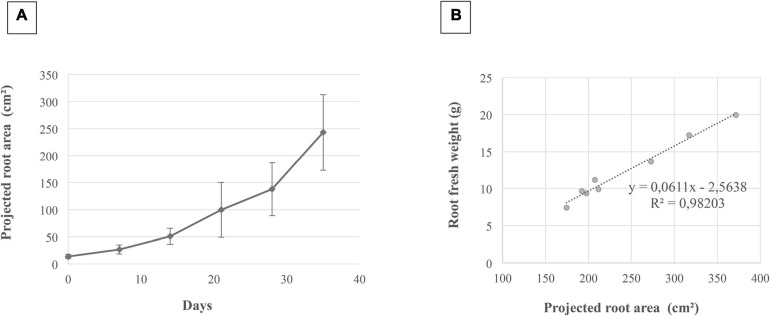
FIGURE 5.
Correlation between the projected root area and root fresh weight. This correlation was determined for grapevine cuttings grown for 5 weeks in rhizotrons. Illustration of the projected root area calculated from root image analysis on 72 images (A). Four images were analyzed for each time point, and three biological repetitions were carried out. Bars correspond to standard errors. Correlation between the projected root area and the root fresh weight (B).

