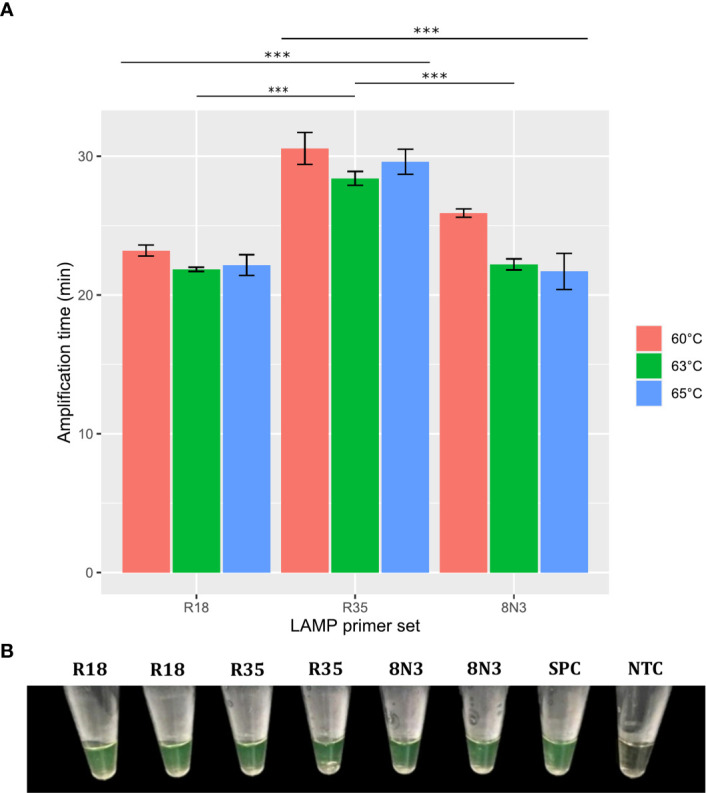
Figure 4.

Effect of temperature and R18, R35, and 8N3 primer sets on RT-LAMP assay performance. Error bars represent the standard deviations of the amplification time mean from independent experiments performed in duplicate. ***P < 0.001. Significance analyzed by one-way analysis of variance (ANOVA) (A). RT-LAMP assays using the R18, R35, and 8N3 primer sets for SARS-CoV-2 detection were considered positive when the solution color changed from brown to green (B). NTC, negative non-template control; SPC, SARS-CoV-2 positive control.
