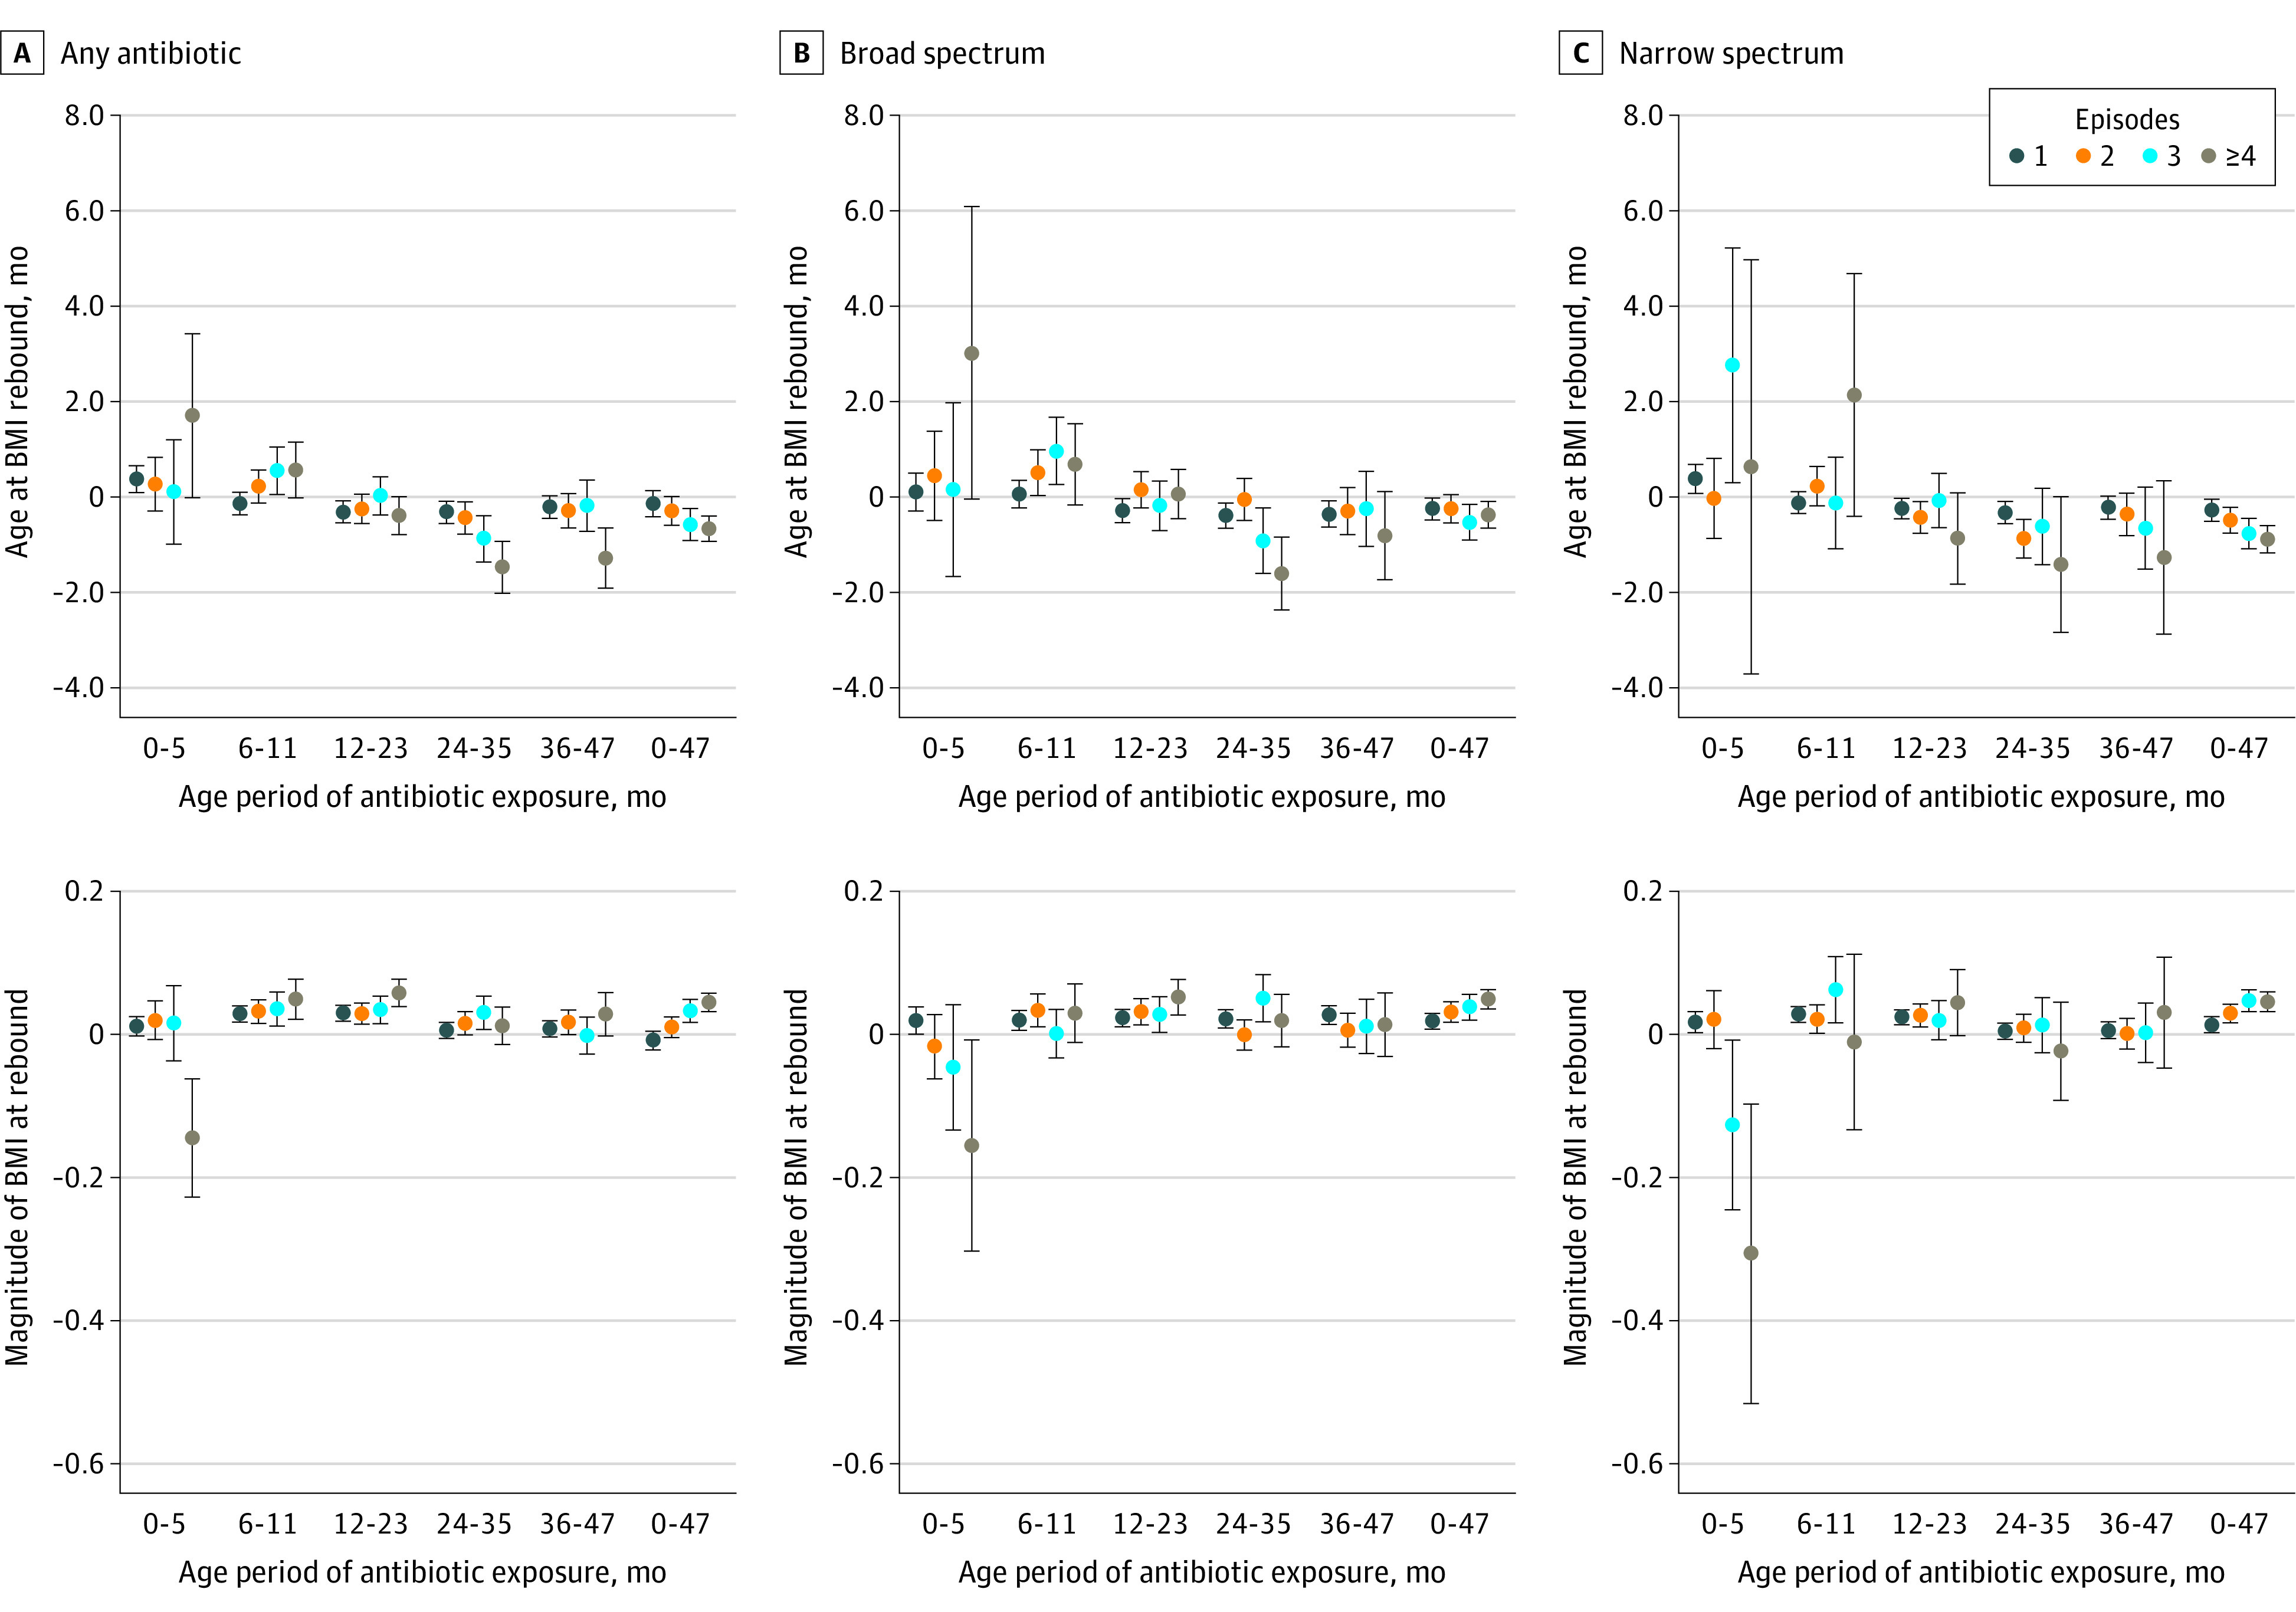
Figure 3. Associations of Antibiotic Exposure at 0 to 47 Months With Age and Magnitude of Body Mass Index (BMI) at Rebound.

Top row of graphs show association with age at BMI rebound; bottom row, magnitude of BMI at rebound. BMI is calculated as weight in kilograms divided by height in meters squared. Error bars indicate 95% CI.
