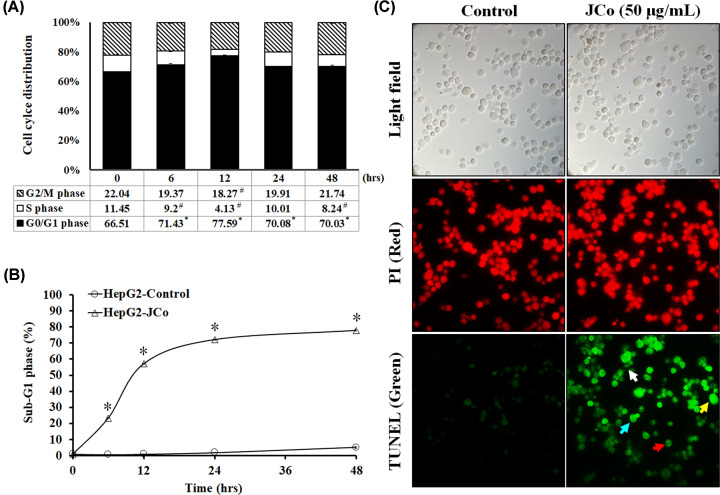
Figure 3. Effects of JCo extract on cell cycle distribution and apoptosis in HepG2 cells.
HepG2 cells were seeded in 96-well plates and then treated with JCo extract (50 μg/ml) for 0, 6, 12, 24 or 48 h. (A) Analysis of cell cycle distribution of cells treated with JCo extract by flow cytometry. (B) Cells in the sub-G1 phase are presented as a percentage of the total cell count. (C) After treatment with JCo extract, cells were harvested and stained by TUNEL. Red: PI; green: TUNEL positive; white arrow: apoptotic bodies; yellow arrow: DNA fragments; blue arrow: chromatin condensation; red arrow: anoikis. *: significant increases in treated cells as compared with control cells; #: significant decreases in treated cells as compared with control cells (P<0.05).

