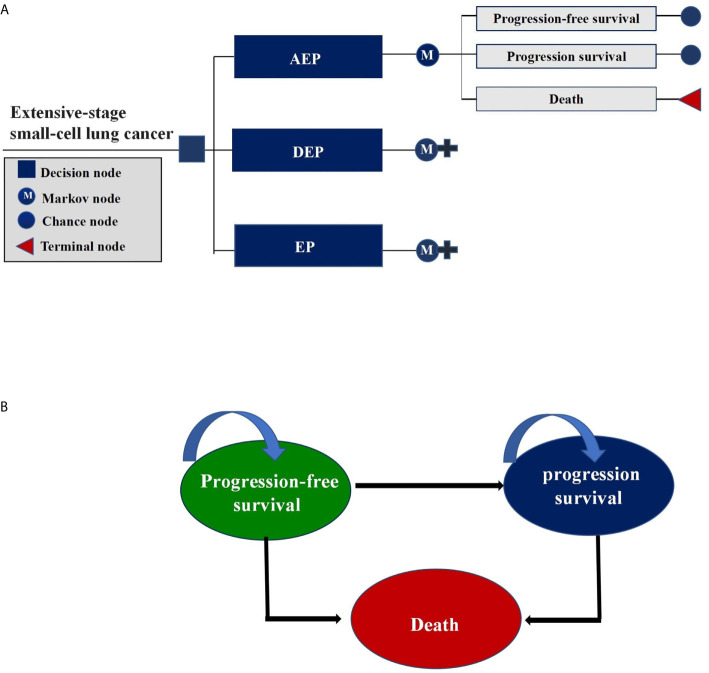
Figure 1.
Markov Model. (A) Schematics of the decision tree showing 3 treatment strategies compared in our model for patients with extensive-stage small-cell lung cancer; (B) Markov state transition model diagram showing 3 health states that represented the process of disease progression. M indicates Markov model.

